The most significant benefit of Defog is that it downloads Amazon Sellers’ data to Google Sheets and automatically updates it.
Defog adds the data to Google Sheets because it is a platform widely used by small and medium stores. Google Sheets is cheap and can even be free for Gmail users, whereas if we had chosen to add the data to a database, sellers would have to pay for hosting and data transfers.
But suppose, in your business case, instead of using Google Sheets for your visualizations, you prefer to have the data on Microsoft PowerBITM or another Business Intelligence platform and create your dashboards there. Defog is also valuable in this case, as connecting Defog’s Google Sheets data tables with PowerBi is effortless. Moreover, once connected, you only need to click ‘Refresh’ on PowerBI to load the newest data from Defog. If you still don’t use Defog, try it for free here.
In this article, we will walk you through the steps to integrate a Defog spreadsheet with PowerBI using the desktop version of PowerBI.
First, ensure you have the latest version of PowerBI installed on your PC.
Step 1: Open PowerBI on your PC and Choose “Get data from other sources.”

Image 1 – Get data from other sources
Step 2: Search for ‘Google Sheets’ in the Get Data field. Select the Google Sheets connector and click Connect.

Image 2 – Choose the Google Sheets connector
Step 3: Click Continue on the notification about connecting to a third-party service. A window will show up asking for a Google Sheets URL. You should go to your Defog and select the URL from the address bar (image 3). Add this URL to the window in PowerBI (image 4) and click OK.
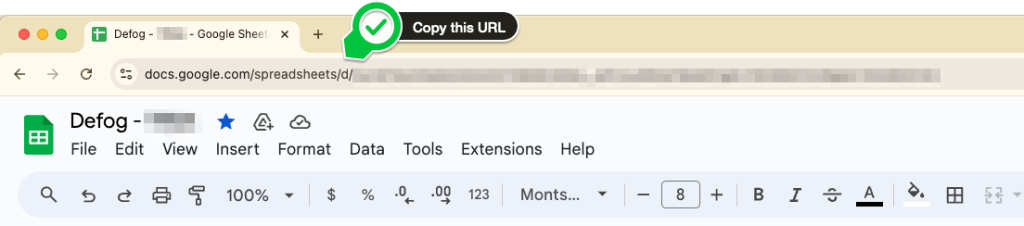
Image 3 – Google Sheets spreadsheet’s URL
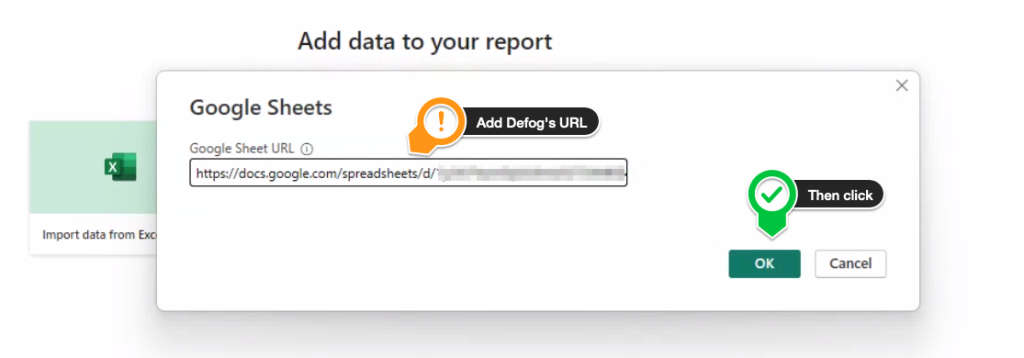
Image 4 – Defog URL from your browser’s address bar
Step 4: A new window will appear in the middle of the screen. You must now Sign in with your Google credentials to allow PowerBi to connect to your Google Sheets (image 5). Click Sign in and sign in with the same user who has access to your Defog. You will then have to authorize PowerBI to access the spreadsheets—to that, click Continue (image 6). Return to PowerBi and click Connect.
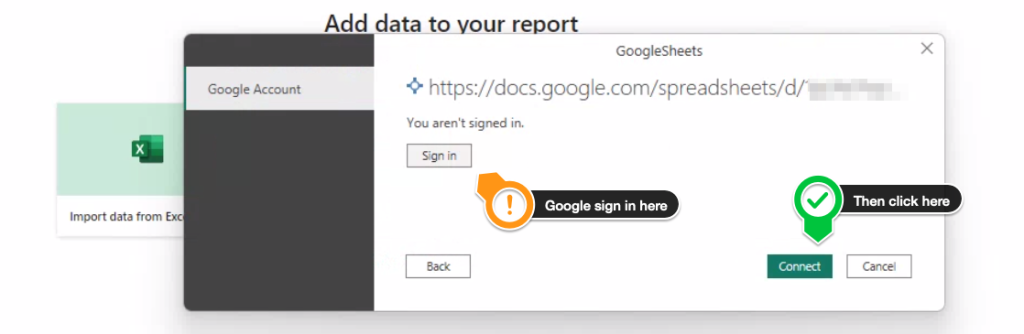
Image 5 – Sign in with Google
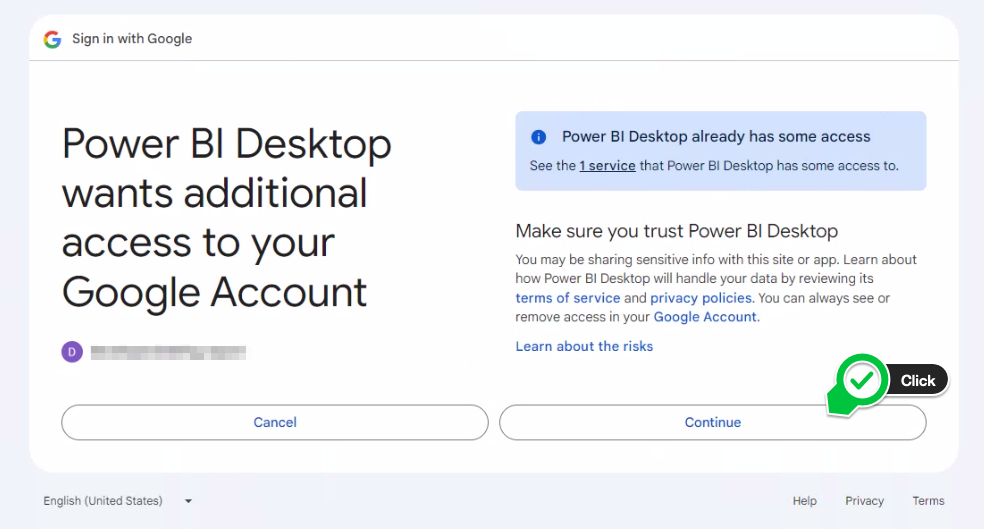
Image 6 – authorize PowerBI to access the spreadsheet
Voilá! You are connected and can add Defog’s tables to your PowerBI.
Step 5: Choose the data tables OrdersTable, Financial Table, AdsTable, InventoryTable, and PerformanceTable (image 7), then click Transform Data.
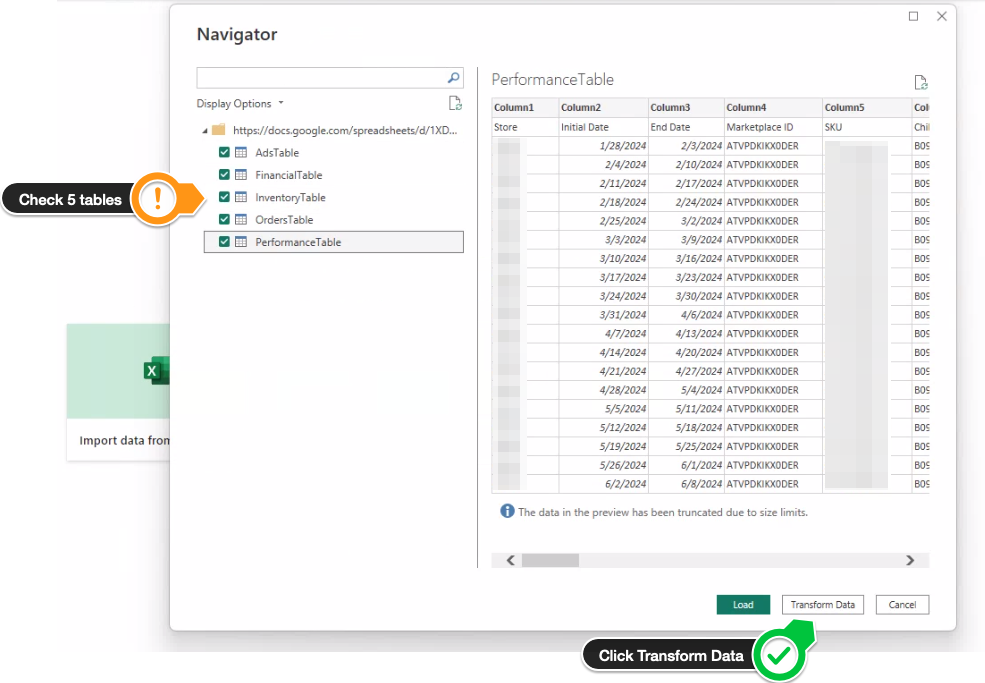
Image 7 – Amazon Seller’s data tables on Defog
Step 6: Select each table on the left panel (Queries) and click ‘Use First Row as Headers’ on the top menu (image 8). The right Panel (Query Settings) will eventually look like image 9 below for each table. You don’t need to worry about dates and number column types, as Defog uses standard forms that PowerBI easily comprehends.
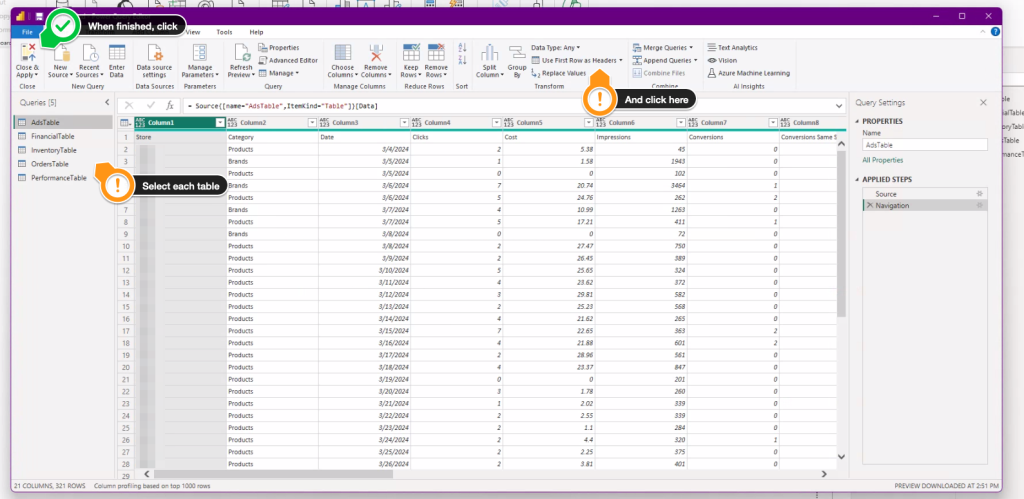
Image 8 – Promote First Row as Headers for each table
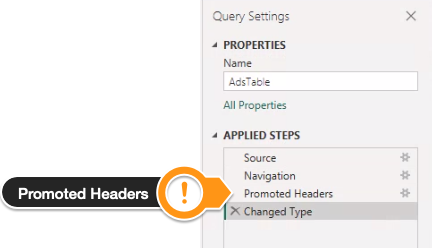
Image 9 – Confirm if each table has these applied steps
Then click Close & Apply (image 8, above). Your data will be available on PowerBI for your dashboard designs (image 10).
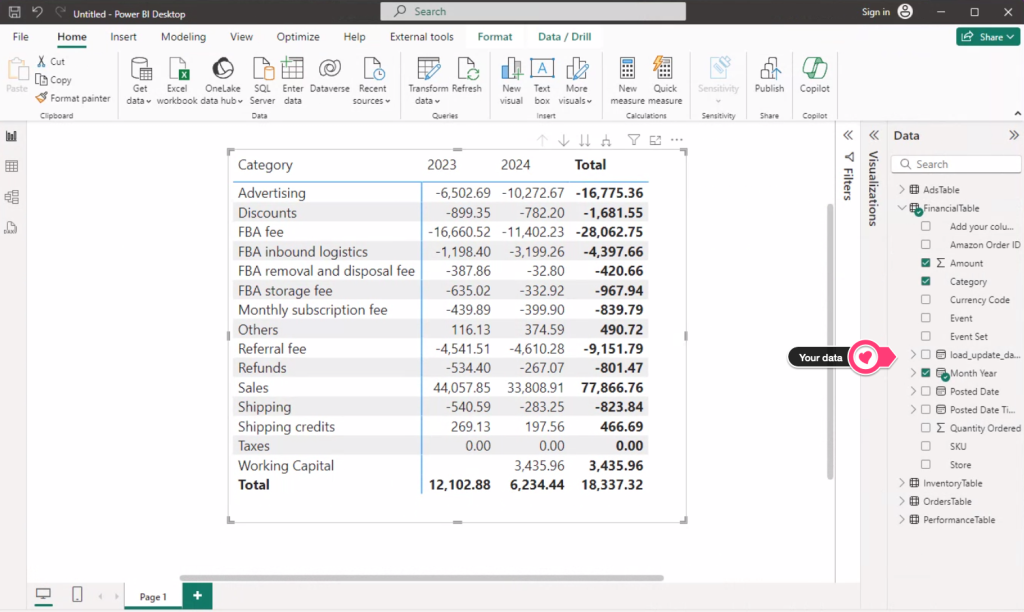
Image 10 – Your data, your way.
Thank you for reading this post. If you still haven’t used Defog, you can try it for free here.
If you need any help, we are here for you. Please click here for support.