Excel and Defog
The most significant benefit of Defog is that it downloads Amazon Sellers’ data to Google Sheets and automatically updates it.
With Defog, sellers may use Google Sheets tables and charts to analyze their data through dashboards. But there is another way. A seller used to Microsoft Excel can use it instead of Google Sheets to create their dashboards.
Connecting Defog’s Google Sheets data tables with Excel is very easy. Once connected, the newest data, automatically downloaded by Defog from Amazon Seller Central, will also be available in Excel with a click of a refresh button. There is no need for web scrapers, CSV files, or connectors. If you still haven’t used Defog, you can use it for free here.
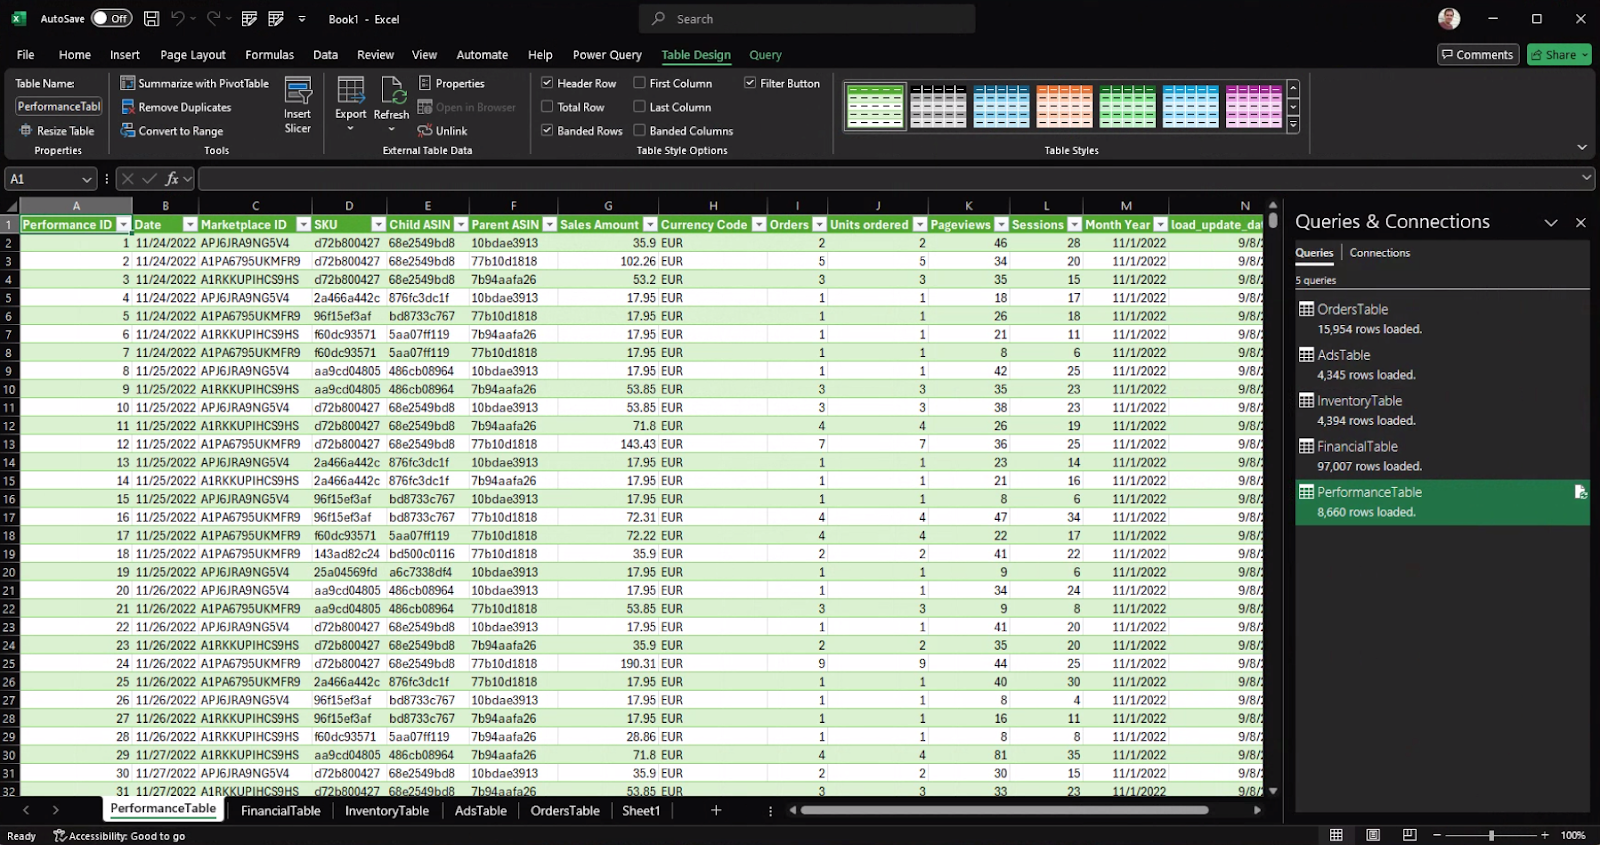
This article will walk you through integrating a Defog spreadsheet with Excel. After you have done the steps below, you will get this Excel workbook:
Step 1: On your Windows PC, open Excel, create a blank workbook, and click on Data > Get Data > From Other Sources > From Web (Image 1.1). A pop-up window will appear (Image 1.2). Follow Step 2 below to get the data tables’ URLs.
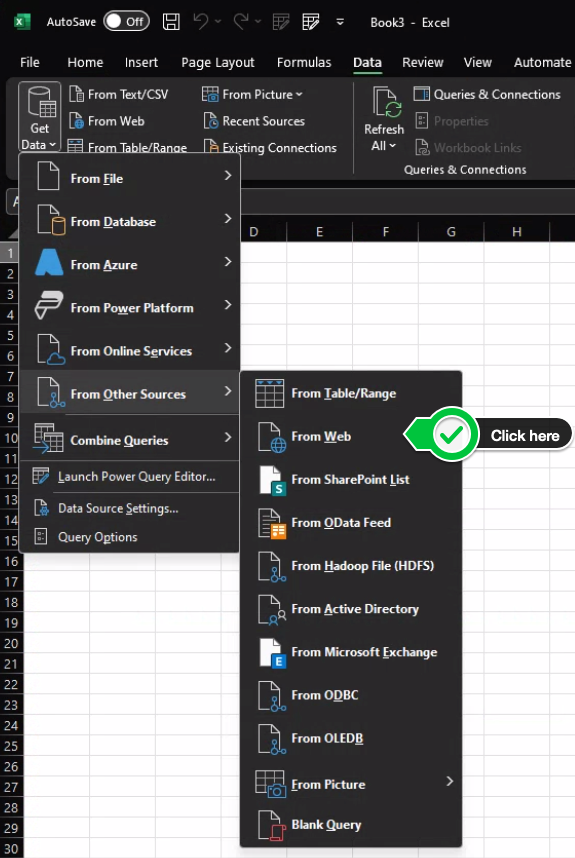
Image 1.1 – Get data from the web
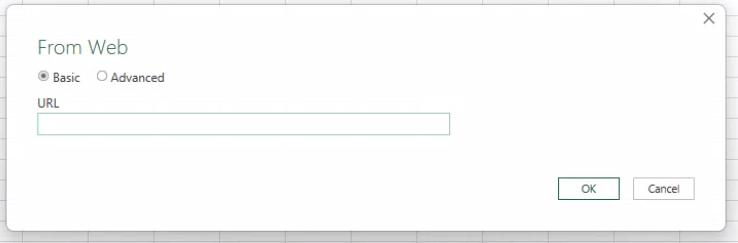
Image 1.2 – You need a URL to connect
Step 2: Start by making your Defog accessible to Excel. On your desktop browser, open your Defog spreadsheet and click on File > Share > Publish on web (Image 1 below). Attention: Publishing a Google spreadsheet online exposes its data to anyone with the link.
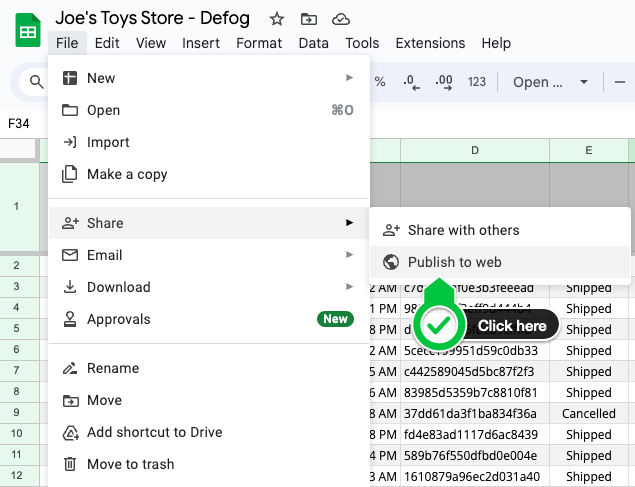
Image 2 – Make your Defog available to connect with Excel
Step 3: Select OrdersTable on the left pull-down menu and set the right pull-down menu to Comma-separated values (CSV), then click on Publish.
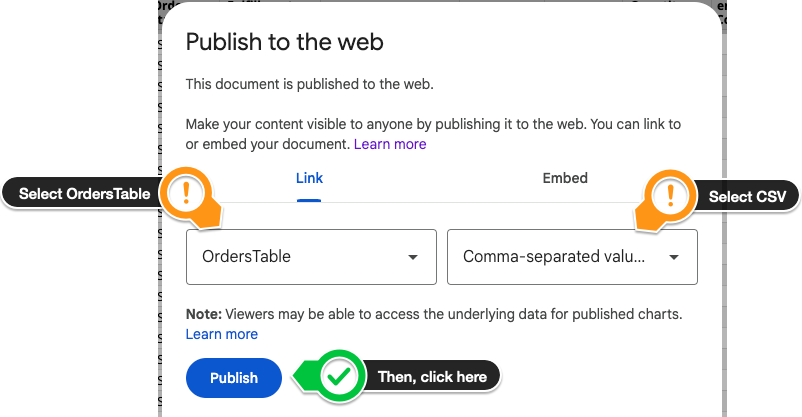
Image 3 – Select OrdersTable, CSV format, and Publish
Step 4: Copy the table URL (Image 4.1) and paste it into the pop-up window on Excel (from Image 1.2) as in Image 4.2, then click OK.
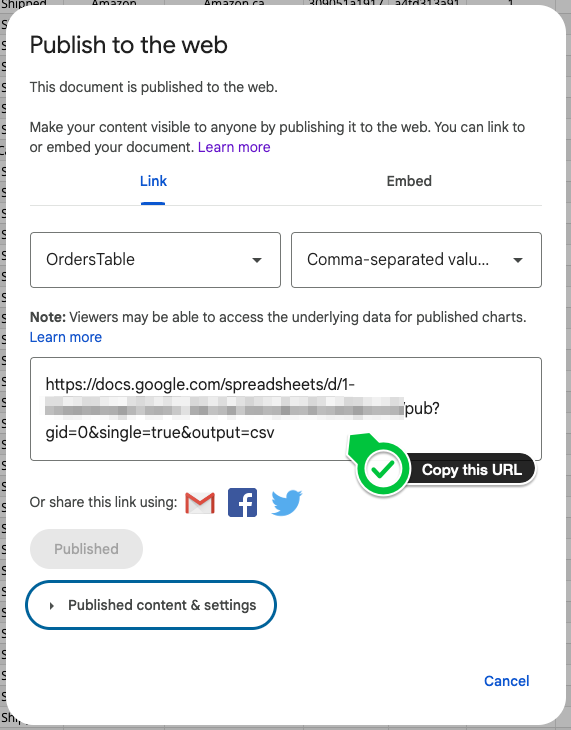
Image 4.1 – OrdersTable URL
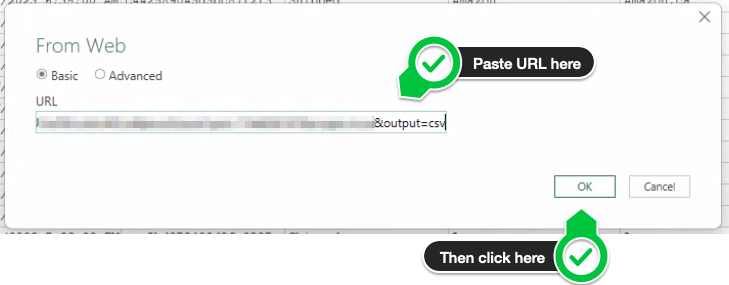
Image 4.2 – Fill in the URL
Step 5: Part of the data on Defog’s table will appear in a window, as in Image 5, for your verification. Note that Excel correctly interpreted the column types and formats. Click OK.
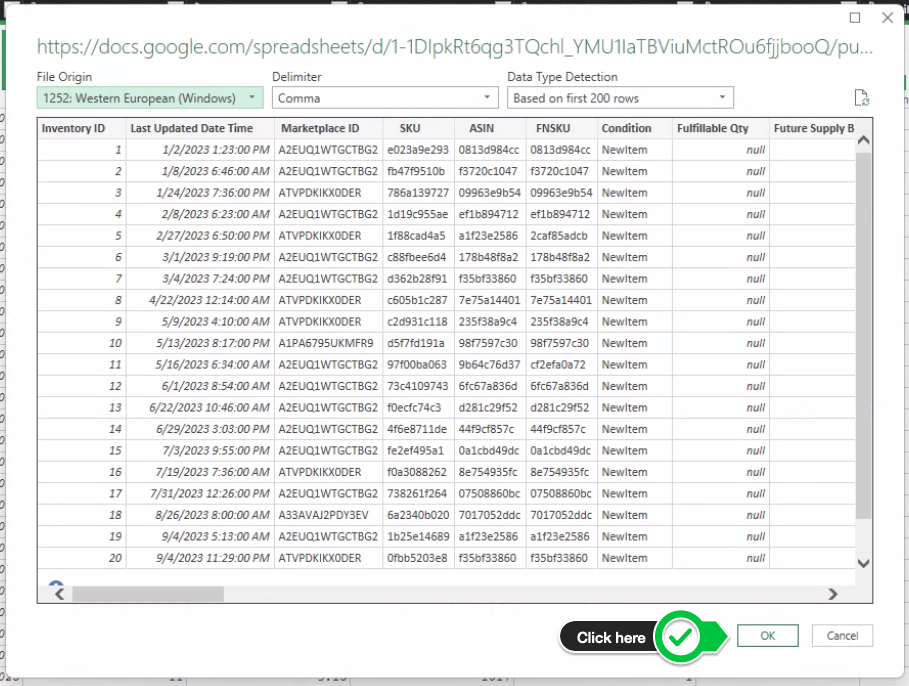
Image 5 – Click OK to add the data
Step 6: Now, for the next table, on Excel, click on New Source > Other Sources > Web (Image 6). Go back to Defog’s sharing window, choose AdsTable, copy the URL, and paste it into the popup window in Excel as in Step 4 above. Repeat this step with the other three tables from Defog: FinancialTable, InventoryTable, and PerformanceTable.
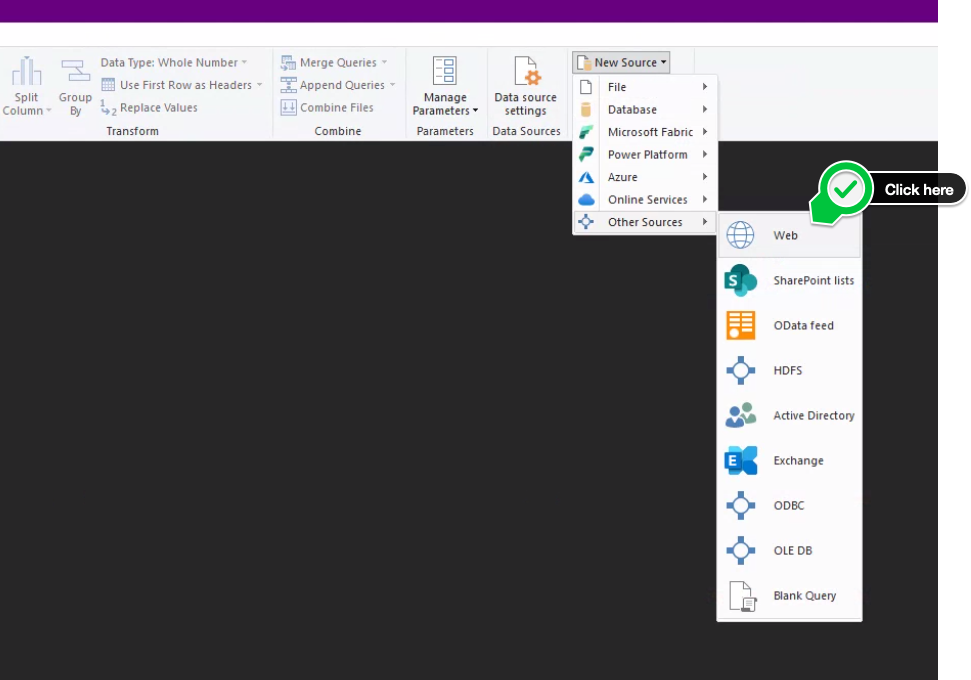
Image 6.1 – Add a new source in Excel
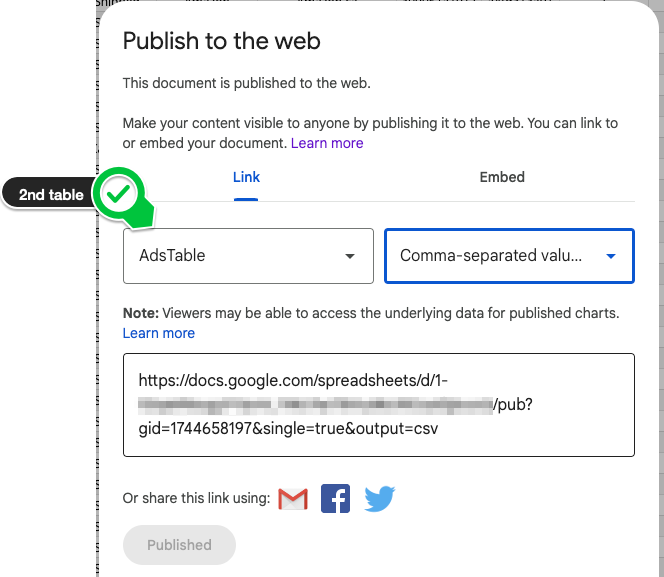
Image 6.2 – Choose AdsTable and copy the URL
Step 7: Rename each table – right-click on each table and choose Rename. In the end, you will see what is in Image 7.1. Then click on Close & Load on the ribbon.
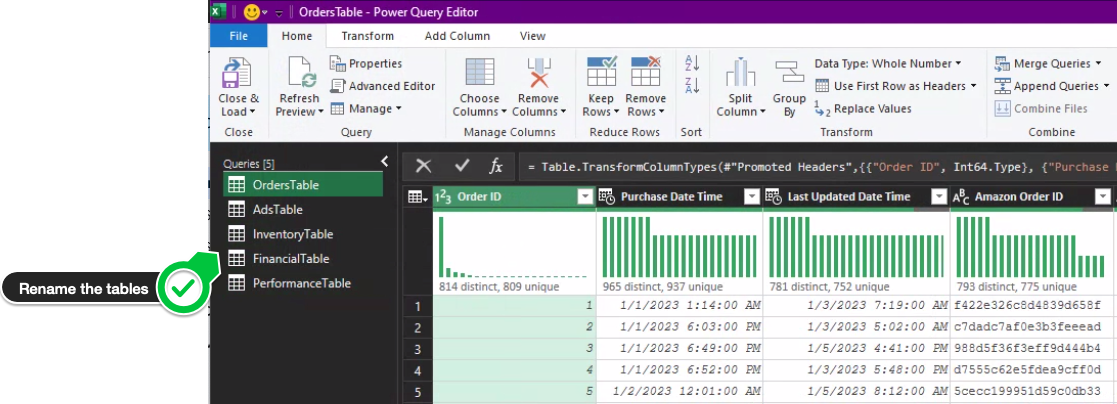
Image 7.1 – Rename all tables
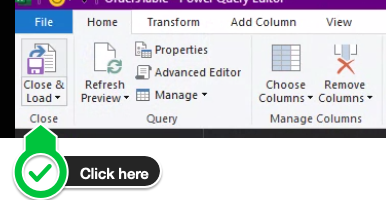
Image 7.2 – Click to load the data into the Excel workbook
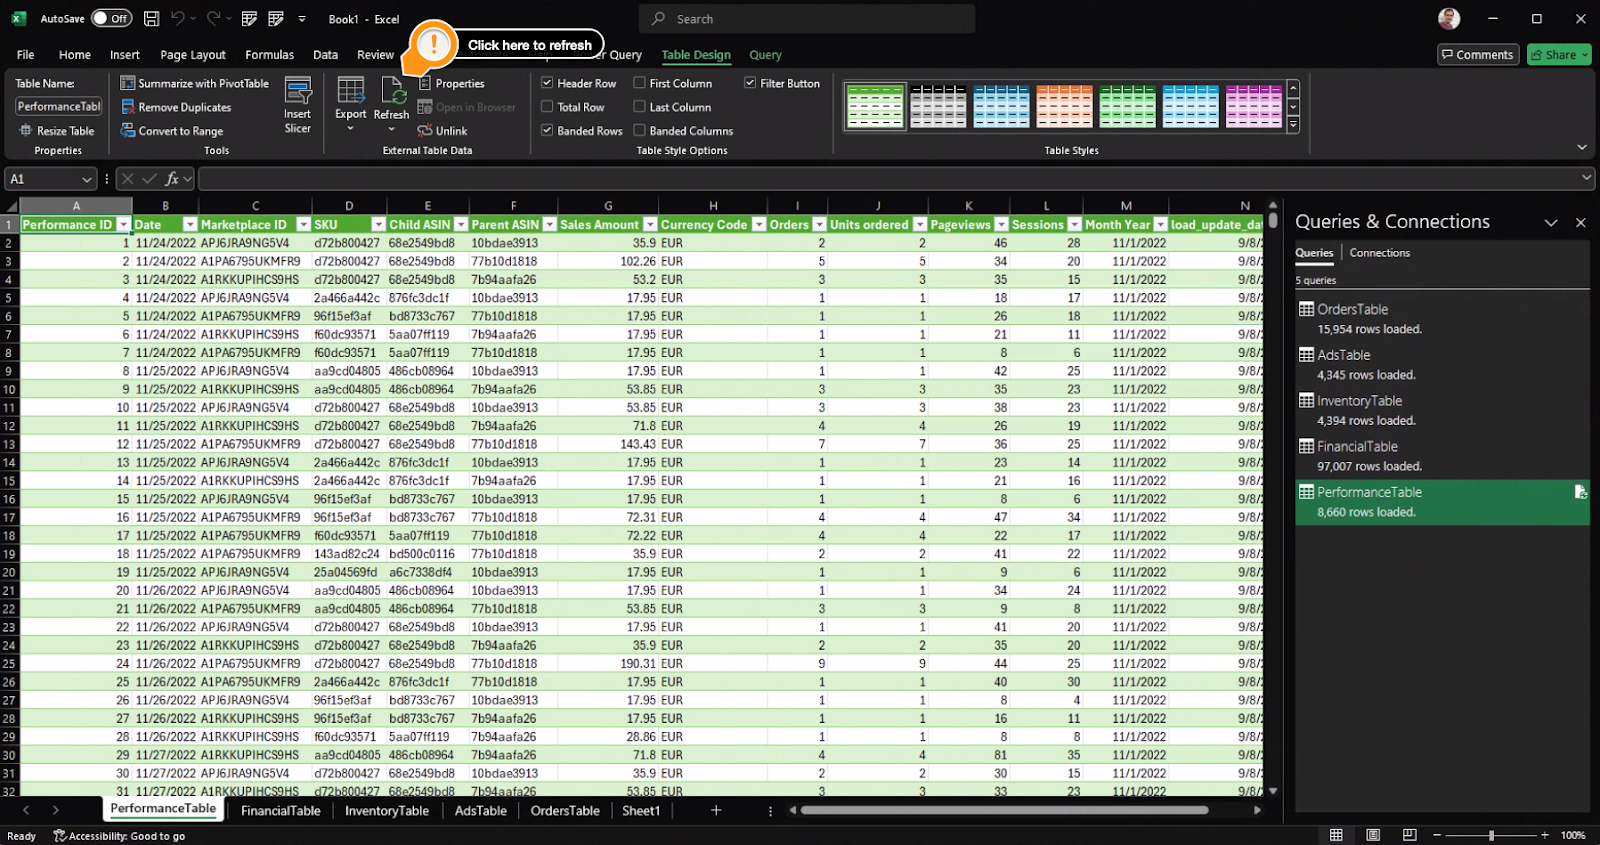
When you want to refresh the data with the latest data published on Defog, you only need to click Refresh on the ribbon.
If you want to learn what a table column stands for, please click here to our glossary.
Thank you for reading this post. If you still haven’t used Defog, you can do so for free here.
If you need any help, we are here for you.
Disclaimer: Publishing a Google spreadsheet online exposes its data to anyone with the link. Defog is not responsible for the reader's decision to openly publish their data on the web or for any decisions made by the reader of this post regarding using the data and formulas provided by Defog.