Calculate Your Profit For Better Planning
The most significant benefit of Defog is that it integrates Amazon Seller Central’s data with Google Sheets. Sellers may then use the data to do many things, one of the most important being calculating the profit per SKU to better decide the product portfolio and pricing strategy.
In this article, we will show you how to calculate the profit per SKU by walking you through creating a simple table with each SKU with revenue data minus expenses and costs you incur while selling on Amazon and a second one where you will input your COGS (Costs of Goods Sold) per unit.
The profit per SKU comes from subtracting the COGS and weighted costs by sales volume from the revenue. You may as well use the principle illustrated in this post to create a profitability calculation for your entire store.
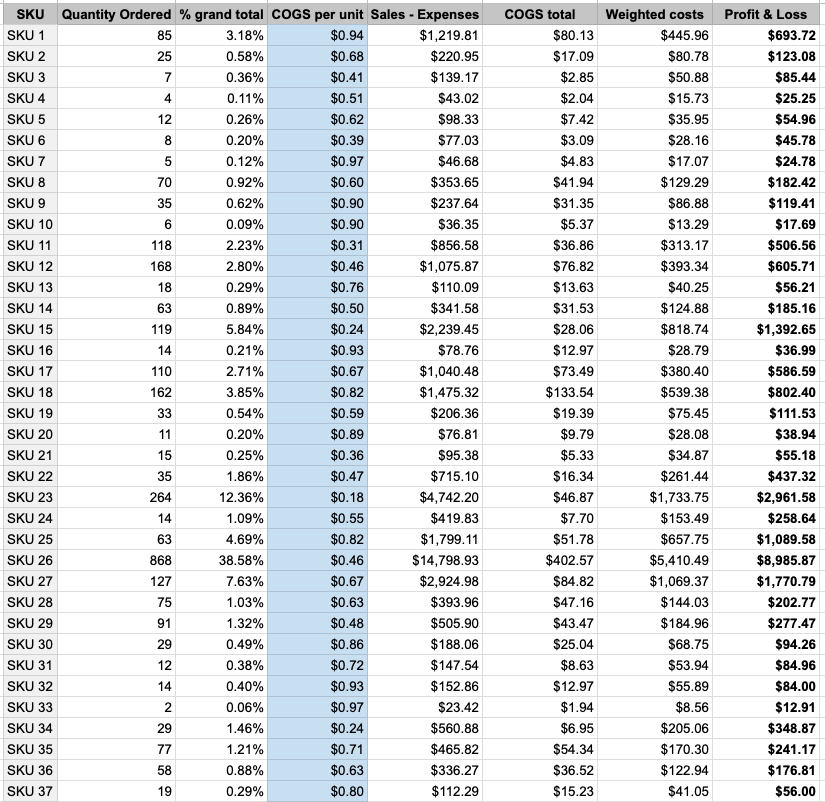
You will be making a table like the one below:
One good thing about doing this in Defog’s spreadsheet is that as soon as Defog updates the data, the tables will be automatically updated, so your store profitability will be current every time you open Defog.
Step 1: On your desktop browser, open your Defog spreadsheet on the FinancialTable tab.
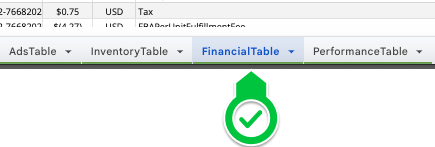
Image 1 – Open Defog on the FinancialTable tab
Step 2: Start by selecting the initial column of your pivot table. Click on the Column D.
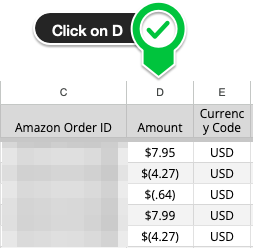
Image 2 – Click column D
Step 3: Now select the final column of your pivot table. Shift-click on Column L. You have selected all rows between Columns D and L, including the ones that will be added in future updates to the FinancialTable.
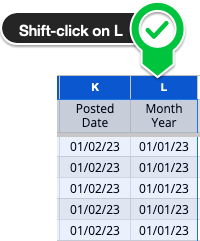
Image 3 – Shift-click column L
Number of units and amount per SKU
Step 4: With the table selected in the previous steps, click Insert on the top Google Sheets menu and then click Pivot table (image 4.1). Then click Create in the pop-up window (Image 4.2). You will create a new tab on your Defog that will look like Image 4.3 below.
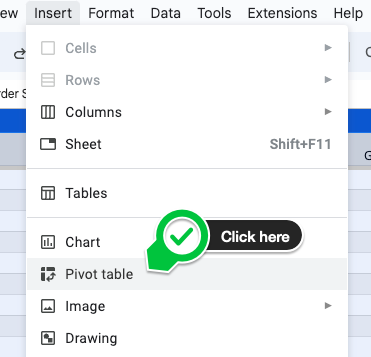
Image 4.1 – Click Insert > Pivot table
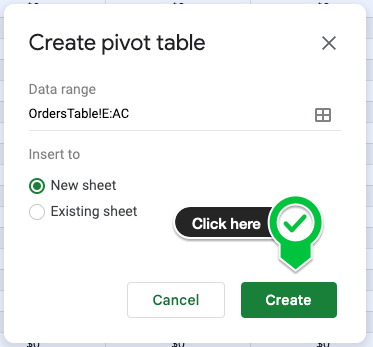
Image 4.2 – Create a pivot table on a new sheet
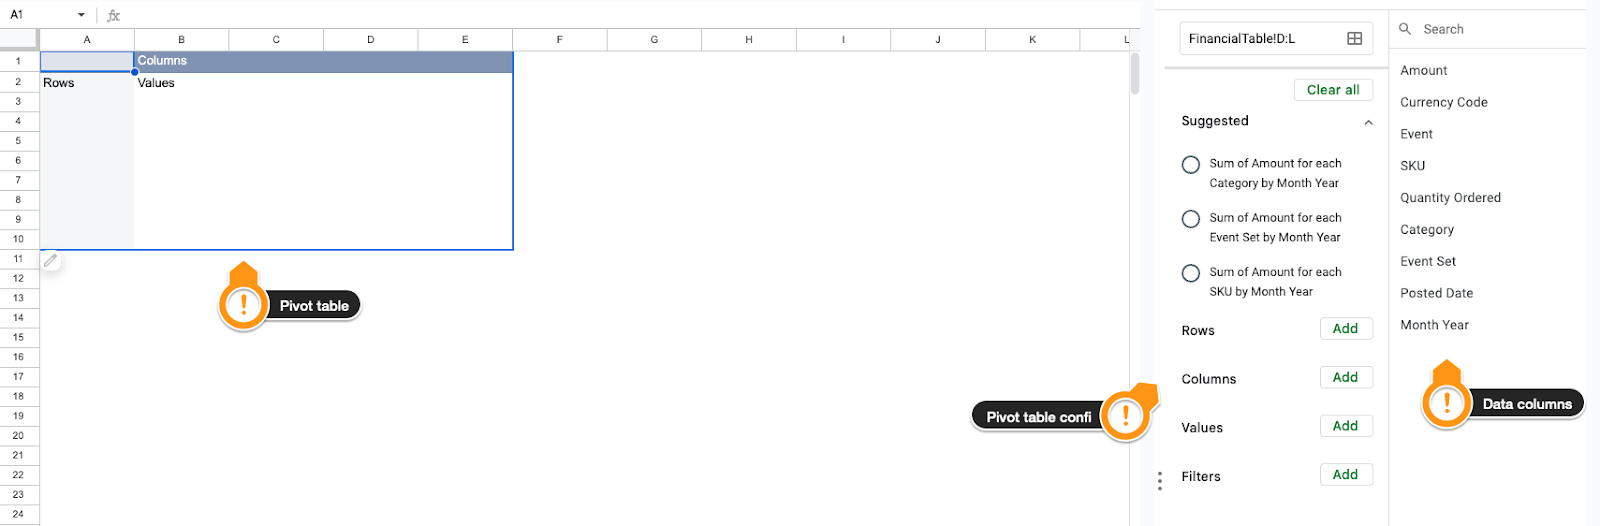
Image 4.3 – Your new pivot table
Step 5: Now is the time to populate your pivot table with the desired data. Let’s start by selecting the SKU. First, click SKU on the data columns to the right of the tab.

Image 5 – Click on SKU
Step 6: Drag and drop the SKU column to the area below the session Rows on the pivot table configuration column (image 6.1). On the new SKU box, unselect the option Show totals. All unique SKUs will appear in the first column on your pivot table.
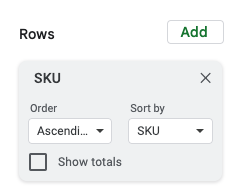
Image 6.1 – SKU under Rows
We must ensure that our table only has closed months to avoid using incomplete data from the current month in the profit calculation. Also, we don’t need all the months available; let’s filter the last six complete months with data to calculate the profitability per SKU. When we created this post, the current month was September 2024, so we will filter out 09/01/24 and start on 02/01/2024, six months before August 2024.
Drag and drop the Month Year column below the session Filters on the pivot table configuration column. Next, on the Month Year box on Filters, click on Filter by condition and then on Custom formula is (the last option at the bottom of the menu). Copy and paste the following formula in the blank text box and click OK (Image 6.2).
=AND('Month Year' >= date(year(today()),month(today())-7,1) ,
'Month Year' < date(year(today()),month(today()),1))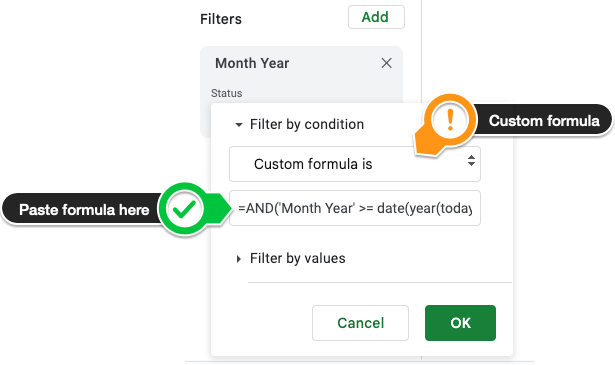
Image 6.2 – Month Year box on the Filters session
Step 7: To select the pivot table values, let’s use the exact drag-and-drop mechanics above. Drag the Quantity Ordered under Values and then drag Amount under Values.
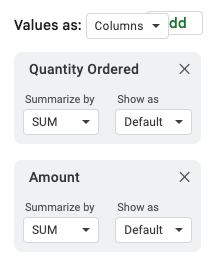
Image 7.1 – Quantity Ordered and Amount on Values
One important aspect of this pivot table is that the Amount per SKU is not the sales amount but the sales amount minus the sales expenses for that SKU. These expenses include FBA fees, referral fees, shipping fees, etc.
Now, you must filter out the financial transactions not associated with an SKU (we will deal with those later). Drag and drop the SKU to the Filters session and uncheck the (Blanks) option (Image 7.2).
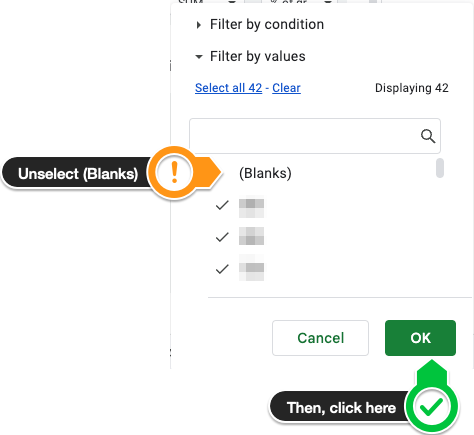
Image 7.2 – Unselect non-SKU-related transactions
Finally, drag and drop Amount once more to the Values session, but this time, on the Amount box’s pull-down menu Show as, select % of grand total (Image 7.3).
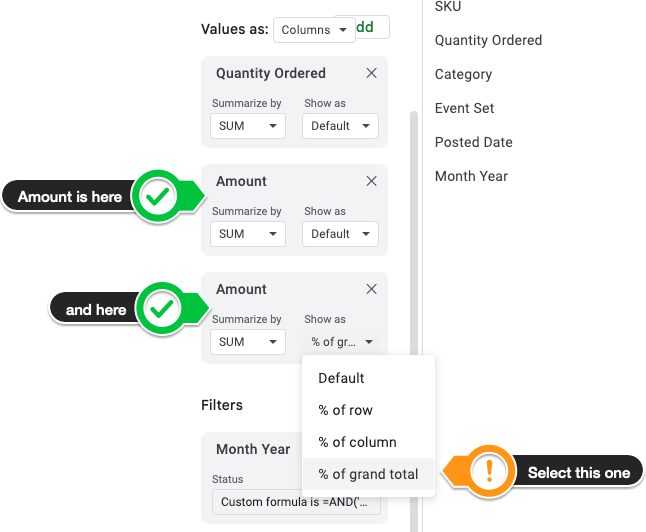
Image 7.3 – Calculate the relative percentage of business per SKU
Step 8: After a few cosmetic adjustments, the table looks like the image below.
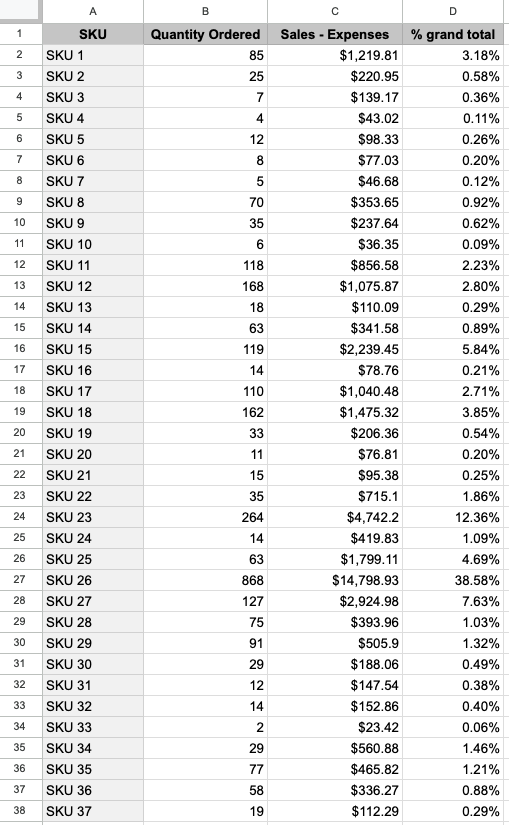
Image 8 – Base table per SKU
Step 9: We need to calculate the total amount Amazon charges your store for other costs of doing business on its marketplace, i.e., advertising costs, storage fees, subscription fees, etc., that are not associated with a particular SKU but are deducted from your store’s revenue anyway. Let’s call those costs Amazon Costs.
Copy and paste the following formula into G1 to calculate the Amazon Costs.
Explaining the formula: We filter out every transaction associated with an SKU before 02/01/24 and after 08/01/24 and the Working Capital category (because Working capital is not a cost).
=-sumifs( FinancialTable!D:D, FinancialTable!G:G,"", FinancialTable!L:L,">="&date(year(today()),month(today())-7,1), FinancialTable!L:L,"<"&date(year(today()),month(today()),1), FinancialTable!I:I,"<>Working Capital")Your Amazon Costs will look like the one in Image 9.
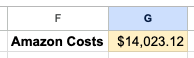
Image 9 – Calculate total Amazon Costs for the period
Step 10: Create a new table with all the SKUs in the blank space starting on I1, then add the following columns from J: Quantity Ordered, % grand total, COGS per unit, Sales – Expenses, COGS total, Weighted Amazon Costs, and Profit & Loss. We suggest painting the background of all the cells below COGS per unit in your preferred light color (Image 10.1).
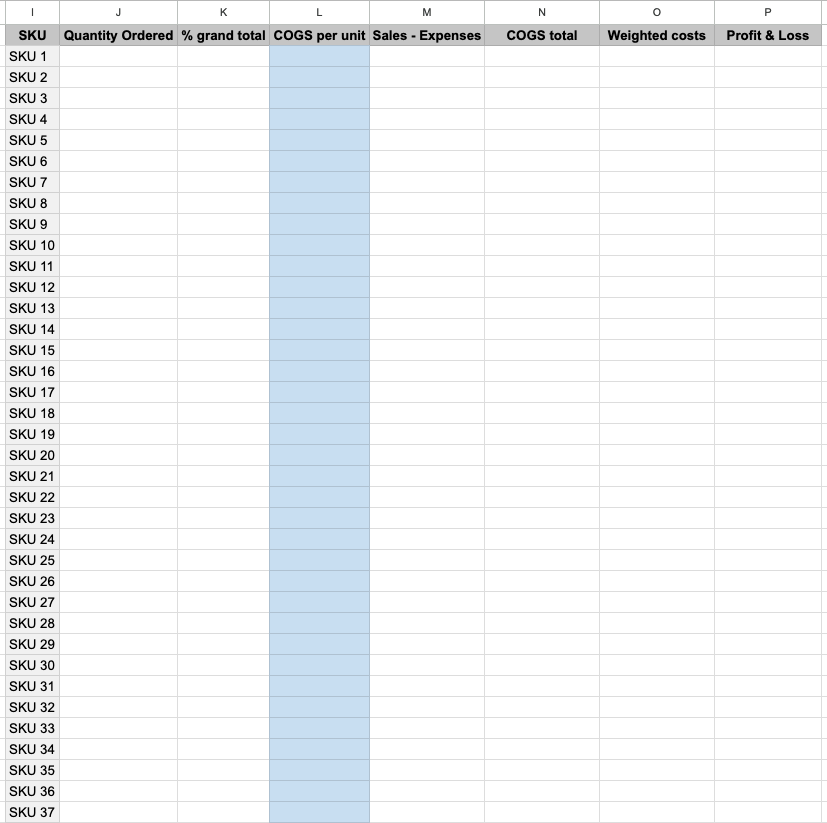
Image 10.1 – Base table for profit calculation
Copy and paste the three formulas below on J2, M2, and K2. Again, after a few cosmetic adjustments, the two tables look like the image 10.2 below.
In J2: Quantity Ordered
=arrayformula(if($I$2:$I<>"",VLOOKUP($I$2:$I,$A$2:$D,2,false),"")) In M2: Sales minus Expenses
=arrayformula(if($I$2:$I<>"",VLOOKUP($I$2:$I,$A$2:$D,3,false),""))In K2: % grand total
=arrayformula(if($I$2:$I<>"",VLOOKUP($I$2:$I,$A$2:$D,4,false),""))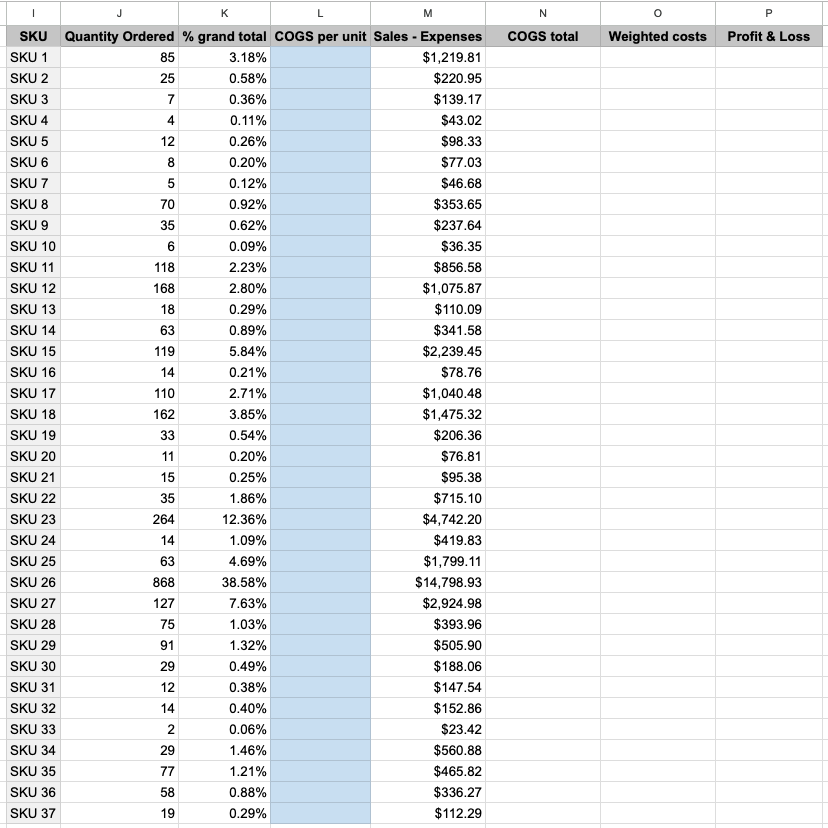
Image 10.2 – Base table with SKU data
Profit and Loss Calculation
You have completed the data table to calculate the profit and loss per SKU. Now, we need to finish it up.
Step 11: In the column COGS per unit cells, type the unit cost of goods sold per SKU (that is why we painted it in a light color); this is the total cost per unit of that SKU before it is sent to Amazon FBA.
Now, copy and paste the formulas below into N2, O2, and P2:
In N2: The COGS total (Cogs per unit times Quantity Ordered)
=ARRAYFORMULA(if(I2:I<>"",J2:J*L2:L,""))In O2: The Amazon Cost weighted by sales volume (Amazon Cost times % grand total)
=ARRAYFORMULA(if(I2:I<>"",G1*K2:K,""))In P2: The Profit and Loss formula
=ARRAYFORMULA(if(I2:I<>"",M2:M-N2:N-O2:O,""))After a few cosmetics editions, here is the final table:
Image 11 – Profit & Loss per SKU
Please note that if you sell in more than one country in the same Amazon Region (North America, Europe, or Far East), Defog will download data from all countries (all marketplaces) to the same OrdersTable. You must do this profit analysis per country or currency, as you cannot sum the total sales amount in different currencies.
Also note that this profit & loss analysis does not include other fixed and variable costs that your store may incur outside those from Amazon, like personnel, rent, advertising on other platforms, etc.
If you want to learn what a particular column stands for on Defog’s tables, please visit our glossary.
Thank you for reading this post. If you still haven’t used Defog, you can do so for free here.
If you need any help, we are here for you.
Disclaimer: This is a simple profit-and-loss analysis. The complete analysis involves nuanced use of costs and even more data than the ones presented in the post. Defog is not responsible for any decisions made by the reader of this post regarding profits or any other use of the data and formulas provided.