The General Ledger (GL) (also known as accounting ledger or general ledger accounts) is an essential tool in bookkeeping, helping companies and their CPAs manage business finances with precision and clarity. By assigning specific codes to different financial transactions, GL codes enable sellers to easily track and categorize income, expenses, and investments. This organized approach simplifies accounting and helps sellers prepare financial reports like balance sheets and income statements. Utilizing GL codes also helps integrate data with financial software like QuickBooks or Xero, which ensures efficient and accurate bookkeeping, supports compliance with tax regulations, and enhances overall financial planning.
Track Financial Performance by GL Code
With Defog, you can seamlessly connect to Amazon Seller Central and retrieve financial data directly into Google Sheets. This allows sellers to monitor and analyze their financial transactions using GL codes. This article will demonstrate how to create a table with a financial report for our sample store for the last three closed months. Using this method, you can easily track key financial metrics such as revenue, refunds, discounts, FBA, shipment and inventory fees, and other expenses over time. Below is a sample table that shows the financial performance of different GL codes, highlighting how sellers can better understand their financial standing across these categories.

A standout feature of Defog’s integration with Amazon Seller Central is its ability to automatically update your tables in Google Sheets. When new data is pulled from Seller Central, your financial reports are instantly refreshed, keeping your analysis current without manual updates. Using today’s date as the base, the reporting period recalculates automatically each month, saving time and improving your reports’ accuracy. This helps Amazon sellers make better, data-driven decisions. With real-time data at your fingertips, you can stay ahead in managing your finances.
Create Custom GL Codes for Better Financial Tracking
To help Amazon sellers manage their finances effectively, Defog allows you to create custom GL Codes that reflect your unique financial transactions. To get started, open your spreadsheet on your desktop browser. Create a new worksheet by clicking the + symbol at the bottom left and rename it GL Codes. In this GL Codes sheet, you will build a table listing each financial event (financial transaction type in Amazon’s terms) and the GL Code you will assign.

Create the GL codes sheet
Step 1: In the GL Codes sheet, use the UNIQUE formula to extract distinct events from the FinancialTable. This will ensure the GL Codes table updates whenever a new event type appears. Copy and paste the formula below into cell A1 of the new GL Codes sheet:
=UNIQUE(FinancialTable!F:F)Step 2: Next, in the GL Code sheet, add the title “GL Codes” to cell B1 and use column B to manually enter GL codes for each unique event. We typically color these cells with a blue background to indicate that they require user input. The events in column A will be automatically populated by extracting distinct values from the FinancialTable, while column B remains editable so you can assign your store’s GL codes. An example of this structure is illustrated in the table below:

Add each event’s GL Code.
If your store offers promotions, you will notice that a few events related to those promotions are listed independently. We suggest that you create a single GL Code for all promotional events. In the example in this article, we use GL Code 009 for all promotions-related events. You can do the same for other related events, keeping the number of GL Codes to a minimum.
You may also ask your accountant for the GL Codes they use for your store, guaranteeing that the reports you produce align with the ones your CPA creates.
Step 3: Now go to the FinancialTable. Edit the column N title to GL Code. This column will map the events from each FinancialTable row to its corresponding GL Code from the new GL Codes table.
As each row in the FinancialTable has an event, we will use a formula to look up the event’s GL Code and add it to the N column. Copy and paste the formula below into cell N2.
=arrayformula(if(F2:F<>"",VLOOKUP(F2:F,'GL Codes'!A:B,2,false),""))
Insert the GL Code lookup formula
Congratulations! You have a new column with each event’s corresponding GL Code in the FinancialTable.
Creating the Financial Report
Step 4: Our financial report will be a pivot table created from the FinancialTable data. To start, click on column D and shift-click on column N, selecting most of the FinancialTable columns.
Step 5: With the table selected in the previous step, click Insert on the top menu in Google Sheets, and then click Pivot table. In the pop-up window, click Create. This will generate a new tab in your spreadsheet where you can begin building your report.

Click Insert > Pivot table to create a pivot table on a new sheet

Your new pivot table
Step 6: Now, it’s time to populate your pivot table with the desired data. First, click Month Year in the data column on the right side of the pivot table tab.

Click on Month Year
Step 7: Drag and drop the Month Year data column into the Columns section in the pivot table configuration panel. The months will now be displayed across the first row of your pivot table, helping you organize the data by period.
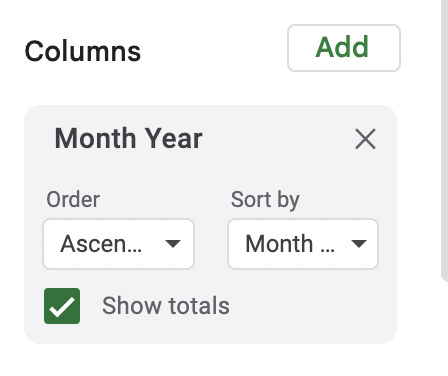
Month Year under Columns
Step 8: Click and then drag and drop the GL Code column into the Rows section in the pivot table configuration panel. All the GL Codes will now be displayed in the first column of your pivot table, allowing you to see the financial data grouped by each code. Unselect the Show totals option on the box.

GL Code under Rows
Step 9: Use the drag-and-drop mechanics from earlier to configure your pivot table values. Drag the Amount column to the Values section. This will populate the table with the total amounts for each GL Code by month, summarizing your financial data.

Amount on Values
Step 10: To correctly filter the table and show only the last three closed months, drag and drop the Month Year column to the Filters section of the pivot table configuration panel.

Month Year box on the Filters section
To filter for only the three previous closed months, click on the Month Year pulldown in the Filters section, then select Filter by condition. Then, choose Custom formula (the last option at the bottom).

Edit the filter condition
Enter the formula below to display only the last three closed months of data (the current month will not appear, as it is not closed yet).
=and(date(year('Month Year'),month('Month Year'),1)>=date(year(today()),month(today())-3,1),date(year('Month Year'),month('Month Year'),1)<date(year(today()),month(today()),1))
Post the formula on the box in the Filters section
Step 13: Your final table looks like the image below after a few cosmetics editions.

Please note that if you sell in more than one country in the same Amazon Region (North America, Europe, or the Far East), Defog will download data from all countries (all marketplaces) to the same FinancialTable, and the data from different currencies will be incorrectly summed up on the table above. If so, you must filter the pivot table by Currency Code (FinancialTable, column E) and create one financial report for each currency.
Additionally, if you use the same GL Codes as your CPA, the FinancialTable with the new column GL Code will significantly help them, as the data is ready to be integrated with their bookkeeping software.
If you want to learn what a particular column stands for on Defog’s tables, please visit our glossary.
Thank you for reading this post. If you still haven’t used Defog, you can do so for free here.
If you need any help, we are here for you.
Disclaimer: Defog is not responsible for any decisions made by the reader of this post or for the consequences of using the data, formulas, and charts provided.