You don’t want to be out of stock as an Amazon Seller. The consequences are dire: you lose sales, of course, but worse than that, you lose your rank, and it will take some time to get back to the same sales performance.
It doesn’t matter if you sell through FBA (Fulfillable By Amazon) or FBM (Fulfillable By Merchant). You need to know beforehand when to restock and how many units to buy.
The metrics you need to forecast how many days of inventory remain for a particular SKU are its sales velocity and the number of units available for sale.
Calculate Days of Inventory Remaining per SKU
The most significant benefit of Defog is that it integrates Amazon Seller Central’s data with Google Sheets, automatically updating the data. Sellers may then use the data to control their inventory, forecast the number of days of stock they have, and avoid stockouts.
Days of Inventory Remaining = Units Available for Sale / Sales Velocity
The days of inventory remaining and the lead time (the time it takes to receive new inventory from your suppliers) are then used to buy new inventory at the right time and in the right quantities.
In this article, we will show you how to calculate the days of inventory remaining per SKU by creating a simple table with the inventory available for each SKU in FBA. We will continue where we left off in this article about sales velocity.
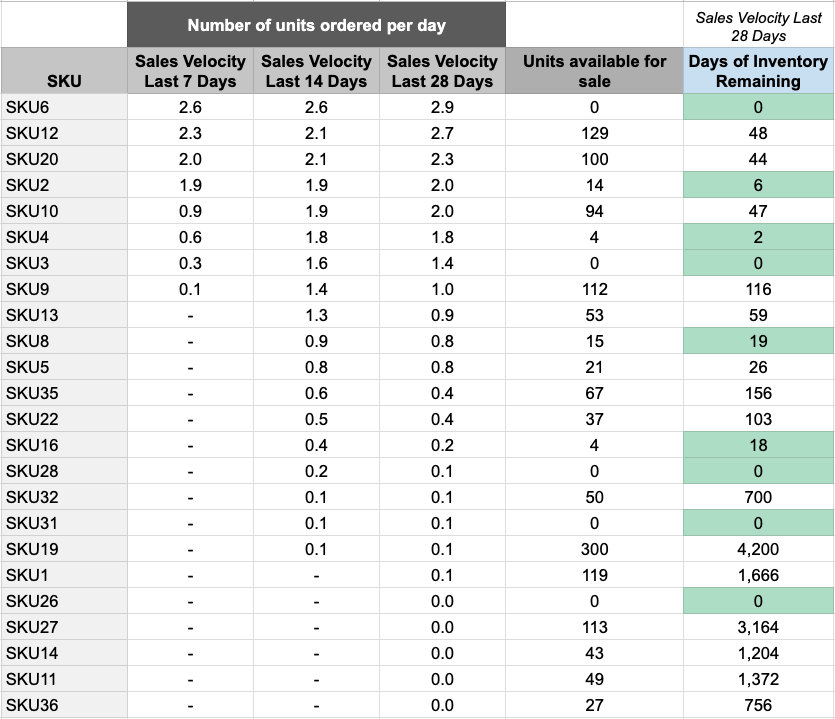
You will be creating a table like the one below, using conditional formatting to highlight products with less than 20 days of inventory remaining:
This table will automatically update when Defog updates with new orders and new FBA inventory information.
Step 1: On your desktop browser, open your Defog spreadsheet on the InventoryTable tab.
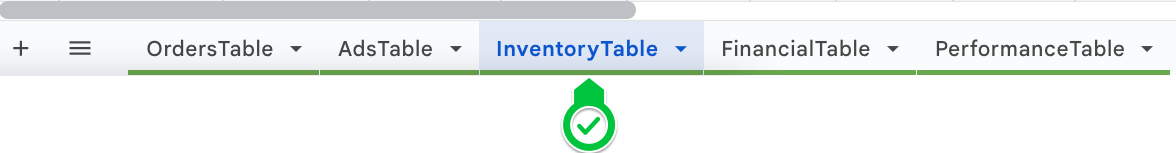
Image 1 – Open Defog on the InventoryTable tab
Step 2: Start by selecting the initial column of your pivot table. Click on the Column C.
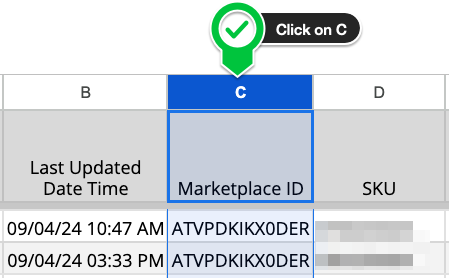
Image 2 – Click column C
Step 3: Now select the final data column of your pivot table. Shift-click on Column AB. You have selected all rows between Columns C and AB, including the ones that will be added in future updates to the InventoryTable.
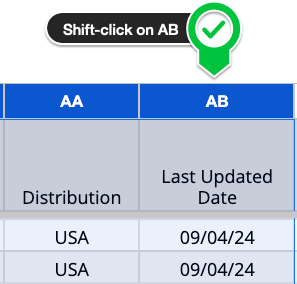
Image 3 – Shift-click column AB
Units available for sale per SKU
Step 4: With the table selected in the previous steps, click Insert on the top Google Sheets menu and then click Pivot table (image 4.1). Then click Create in the pop-up window (Image 4.2). You will create a new tab on your Defog that will look like Image 4.3 below.
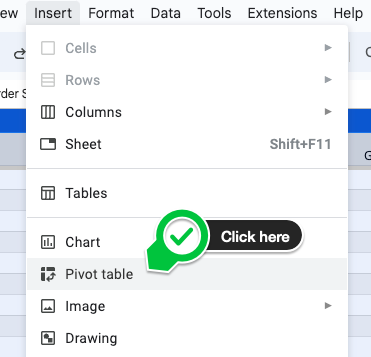
Image 4.1 – Click Insert > Pivot table
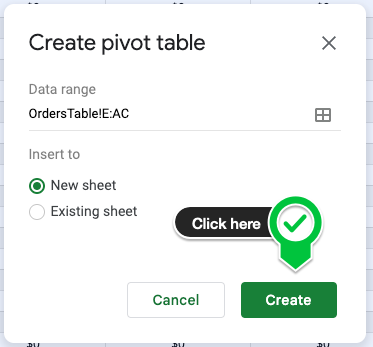
Image 4.2 – Create a pivot table on a new sheet
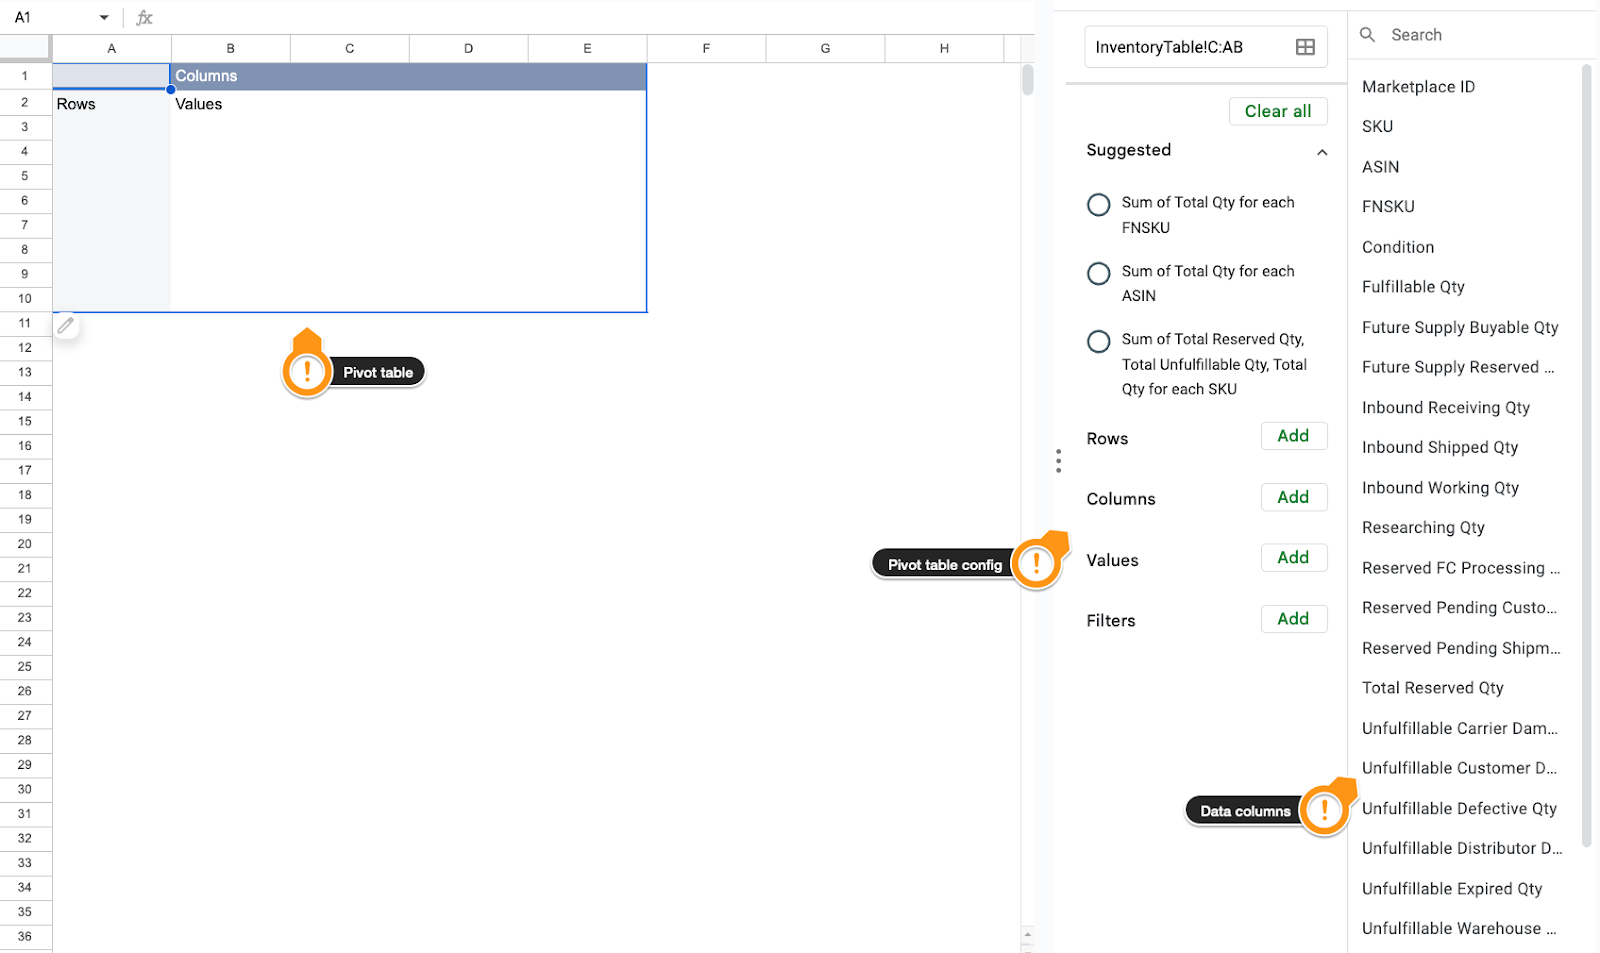
Image 4.3 – Your new pivot table
Step 5: Now is the time to populate your pivot table with the desired data. Let’s start by selecting the SKU. First, click SKU on the data columns to the right of the tab.

Image 5 – Click on SKU
Step 6: Drag and drop the SKU column to the area below the session Rows on the pivot table configuration column (image 6.1). On the new SKU box, unselect the option Show totals. All SKUs will appear in the first column on your pivot table.
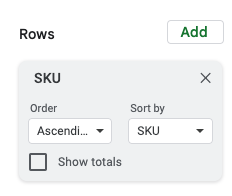
Image 6.1 – SKU under Rows
Step 7: Use the drag-and-drop mechanics above to select the pivot table values. Drag the Last Updated Date data column below Values (Image 7.1). Select MAX in the first pull-down menu to Summarize by, as in Image 7.2. Your new Pivot Table will have the last date the FBA inventory changed for each SKU, i.e., its most recent unit count.
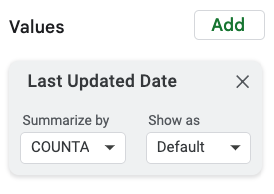
Image 7.1 – Last Updated Date in Values session
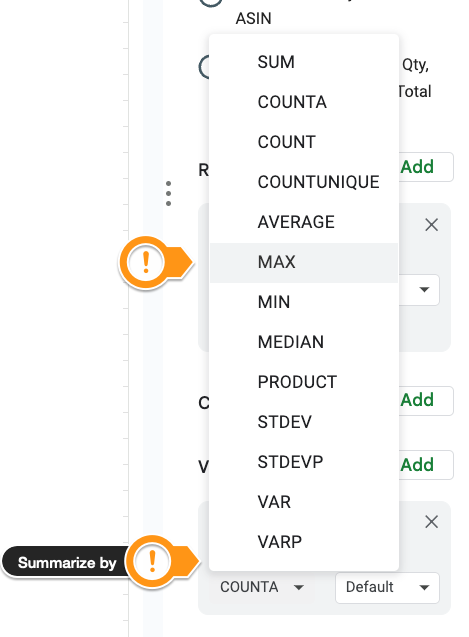
Image 7.2 – Set the pull-down menu on the Last Updated Date box
Step 8: To calculate the units available for sale, create a new column heading on the right of your pivot table, as shown in Image 8.1 below.
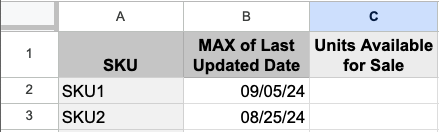
Image 8.1 – Heading for the new column with units available for sale
The FBA inventory units pass through many stages, from when the shipment is created in Amazon Seller Central to when customers receive their orders. Between all FBA stages, what will we consider the total available units for sale? We decided to sum the following columns on InventoryTable (if you want to learn more about each of the columns in InventoryTable, please visit Defog’s Glossary):
- Fulfillable Qty (InventoryTable!H2:H) – units available for immediate sales
- Future Supply Buyable Qty (InventoryTable!I2:I) – units that are still on their way to Amazon in the inbound stages
- Reserved FC Processing Qty (InventoryTable!O2:O) – units that are being processed in or are moving between Amazon fulfillment centers
To continue, copy and paste the following formula on C2.
=arrayformula(if(A2:A<>"",vlookup(A2:A&B2:B,{InventoryTable!$D$2:$D&InventoryTable!$AB$2:$AB,InventoryTable!$H$2:$H+InventoryTable!$I$2:$I+InventoryTable!$O$2:$O},2,false),""))After a few cosmetic improvements, you will have the total units available on the most recent date (Image 8.2).
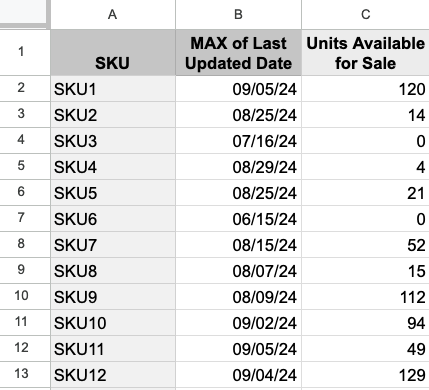
Image 8.2 – Table with units available for sale
Finally, rename the new tab created for the pivot table to Units for Sale (Image 8.3).
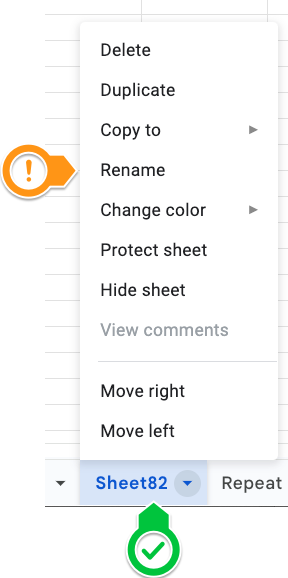
Image 8.3 – Rename the new tab
Days of inventory remaining per SKU
Step 9: Return to the tab created for the sales velocity. Add two column headings on the right of your Sales Velocity Table, as in Image 9.1:
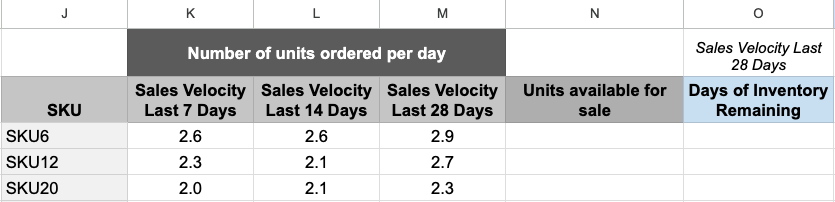
Image 9.1 – Two new headings on the right of the sales velocity table
Copy and paste the following formulas into N3 and O3.
In N3: Most recent FBA data for units for sale
=ARRAYFORMULA(IF(J3:J<>"",VLOOKUP(J3:J,'Units for Sale'!A$2:C$43,3,fALSE),""))In O3: Days of inventory remaining using the sales velocity for the last 28 days
=ARRAYFORMULA(IF(J3:J<>"",ROUNDDOWN(N3:N/M3:M),""))Please note that we rounded the number of days of inventory remaining down to the nearest whole number. Days are, of course, whole numbers, and we want to have the worst-case scenario (round down) for our forecast.
To do the conditional formatting and highlight all numbers below your lead time, select column O, then click on Format > Conditional formatting (Image 9.2).
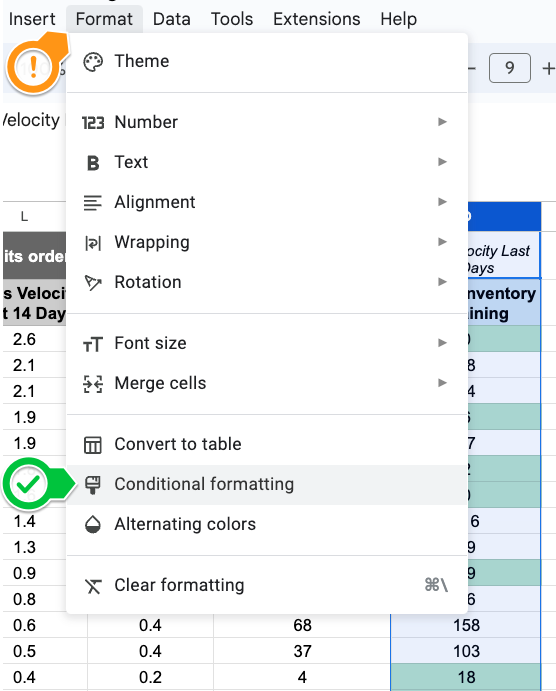
Image 9.2 – Conditional formatting
On Format rules, select Less than and add your lead lime in days to the blank box (Image 9.3).
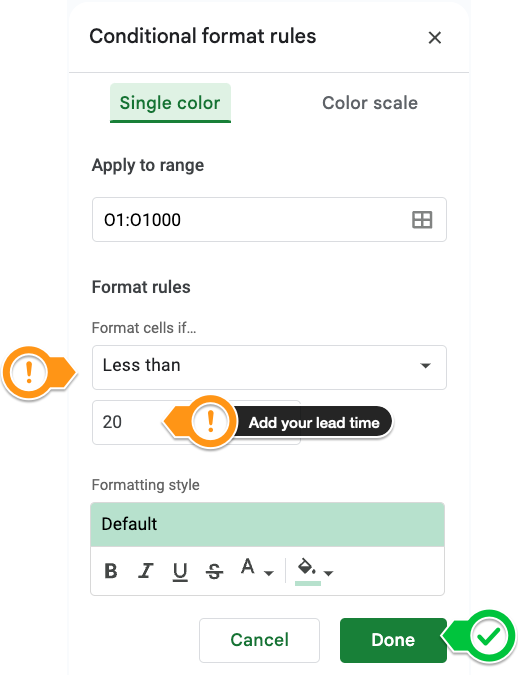
Image 9.3 – Conditional formatting format rules with lead time
Your final table will look like the one below.
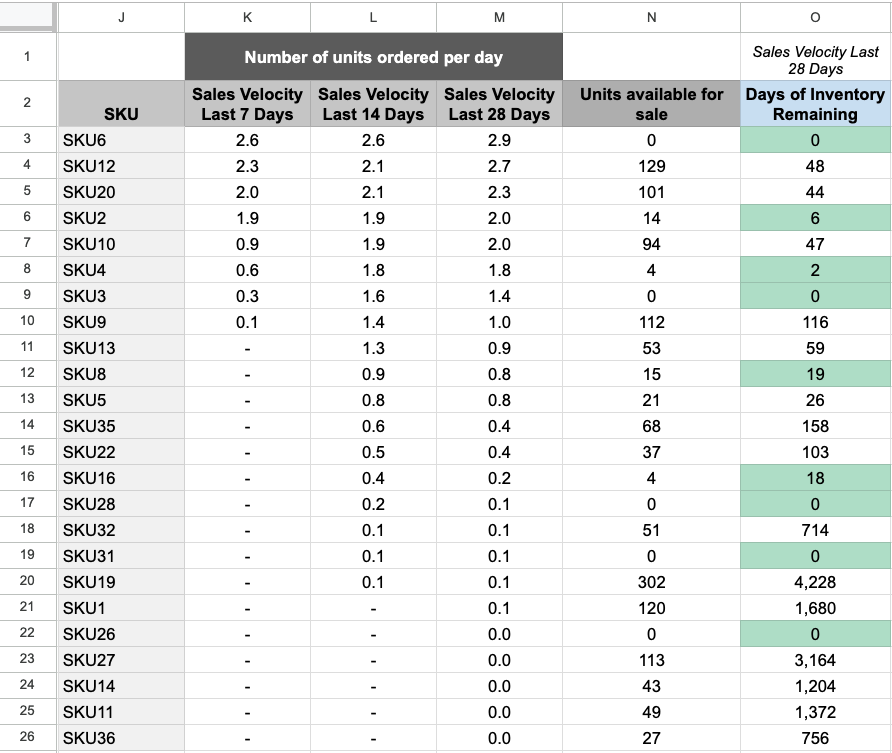
Image 9.3 – Table with Sales Velocity, Units Available for Sale, and Days of Inventory Remaining
We used the Sales Velocity Last 28 Days column for our inventory forecast. Still, you may use one of the other two columns or create three forecasts for each sales velocity and compare them to make restock decisions.
Note that the table may not have all the SKUs, as the sales velocity pivot table only presents SKUs with sales in the period included in the filters. But, as soon as new SKUs are sold, they will automatically appear in the table above. Also, if you sell in more than one country in the same Amazon Region (North America, Europe, or the Far East), Defog will download data from all countries (all marketplaces) to the same OrdersTable and InventoryTable. You must calculate the sales velocity and the units available for sale per region where you have stock.
If you want to learn what a particular column stands for on Defog’s tables, please visit our glossary.
Thank you for reading this post. If you still haven’t used Defog, you can do so for free here.
If you need any help, we are here for you.
Disclaimer: Defog is not responsible for any decisions made by the reader of this post or any other use of the data and formulas provided.