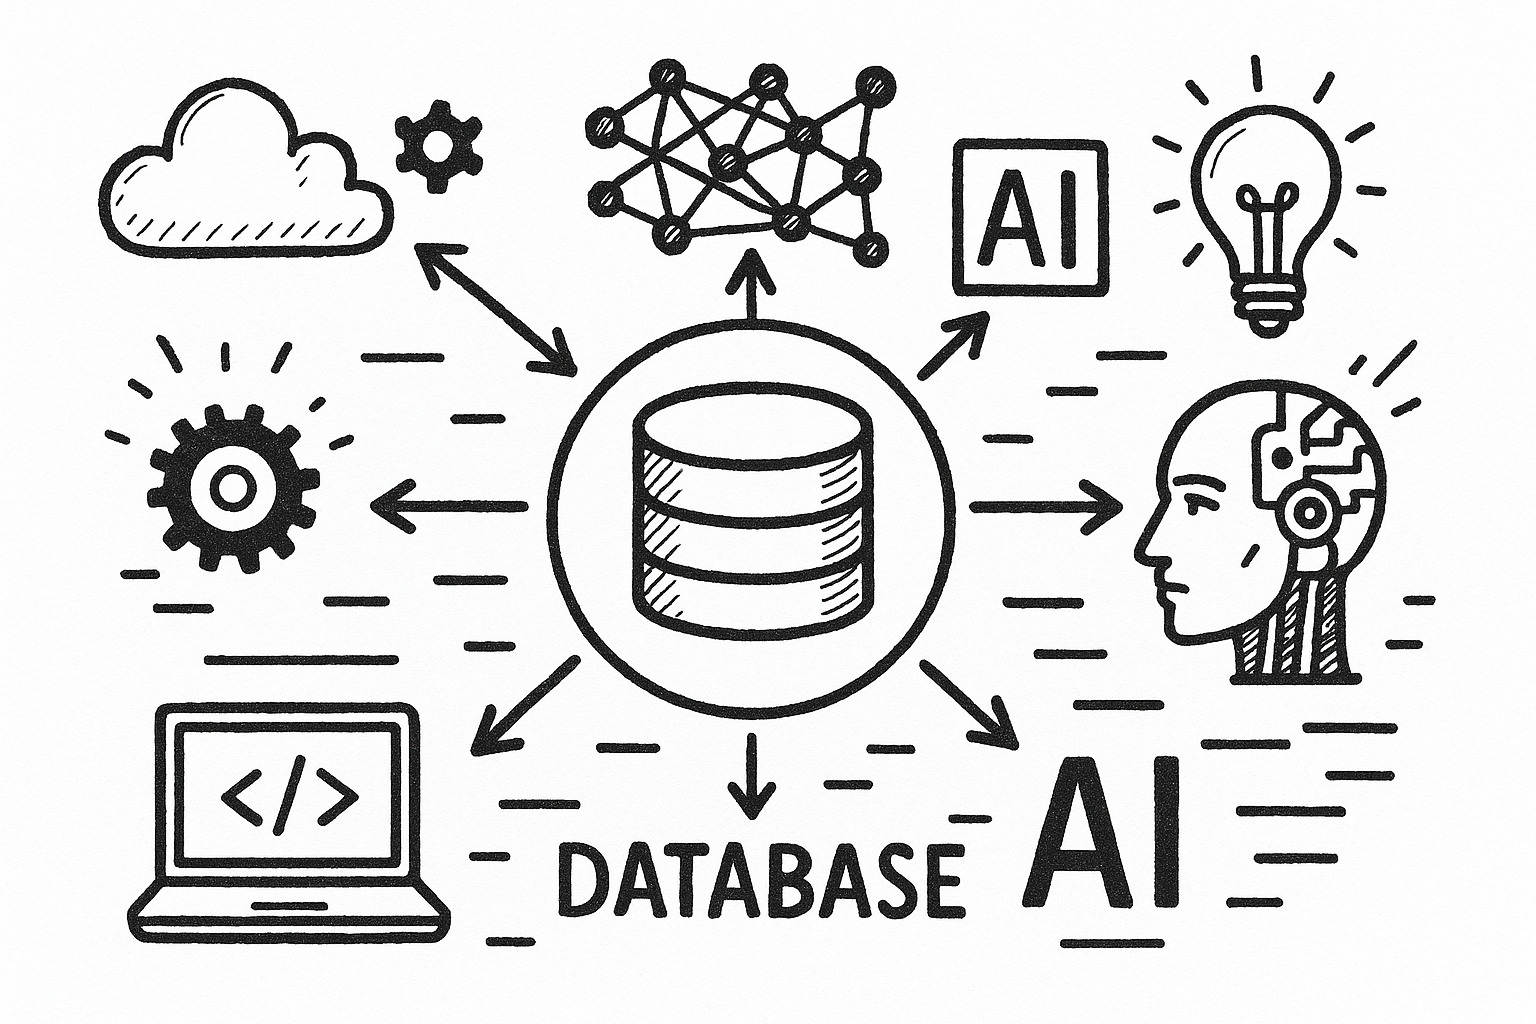
Google Looker Studio and Defog
The most significant benefit of Defog is that it downloads Amazon Sellers’ data to Google Sheets and automatically updates it.
With Defog, sellers may use Google Sheets tables and charts to analyze their data and enhance their dashboards by importing data from sources other than Amazon.
But there is another way. Using Google’s Looker StudioTM, a seller can use all the powerful tools offered by a complete BI tool to create a dashboard and take advantage of many pre-built connectors to add data from other sources (see some of the connectors in Image 6 below).
Connecting Defog’s Google Sheets data tables with Looker Studio is very easy. Once connected, the newest data, automatically downloaded by Defog from Amazon Seller Central, will also be available on Looker Studio, as it offers permanent, live connections.
This article will walk you through integrating a Defog spreadsheet with Google’s Looker Studio. If you still haven’t used Defog, try it for free here.
Step 1: On your desktop browser, open your Defog spreadsheet on the OrdersTable tab and click on Extensions > Looker Studio > Create a report (image 1 below)
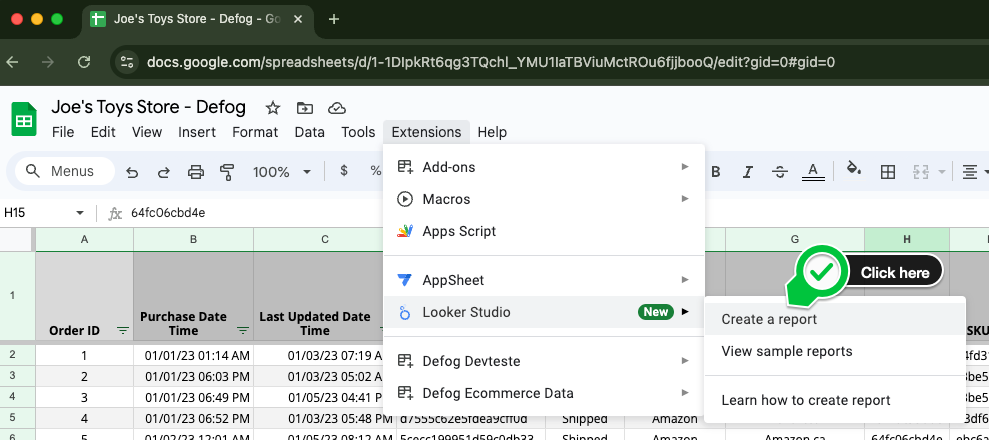
Image 1 – Create a report in Google’s Looker Studio
Step 2: A sidebar like the one on image 2 will open on the right side of the spreadsheet. Notice that Defog has already been recognized and connected to Looker. Click Create.
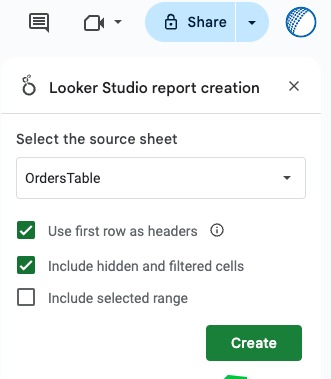
Image 2 – Connect Looker Studio with the OrdersTable on Defog
Step 3: Google will open Looker Studio in a new browser tab or window (Image 3). You may need to allow the browser to open a pop-up now. Go to Looker and observe that your first data table (OrdersTable) is already available (Image 4).
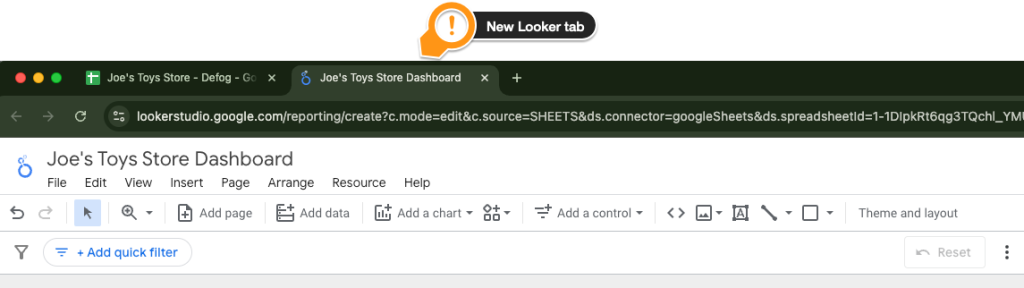
Image 3 – New Looker Studio window or tab
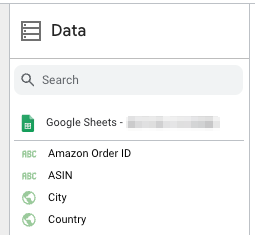
Image 4 – The first data table (OrdersTable) is connected
Step 4: Now, let’s connect the other 4 tables. Click on Add Data on Looker’s top menu (Image 5), then choose Google Sheets as the connector (Image 6). Google may ask you for your company information (Image 7) and authorization to access your spreadsheet (Image 8); follow the steps on the screen to continue.
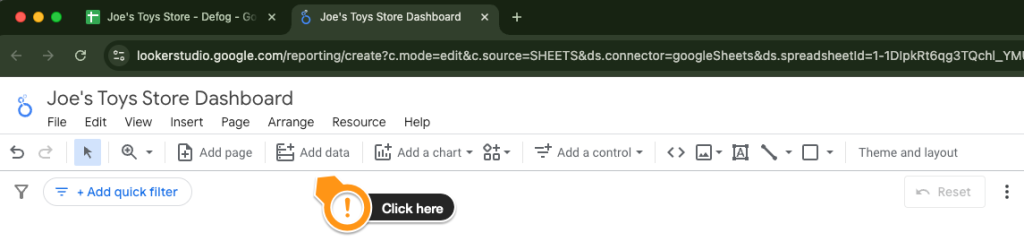
Image 5 – Click Add data
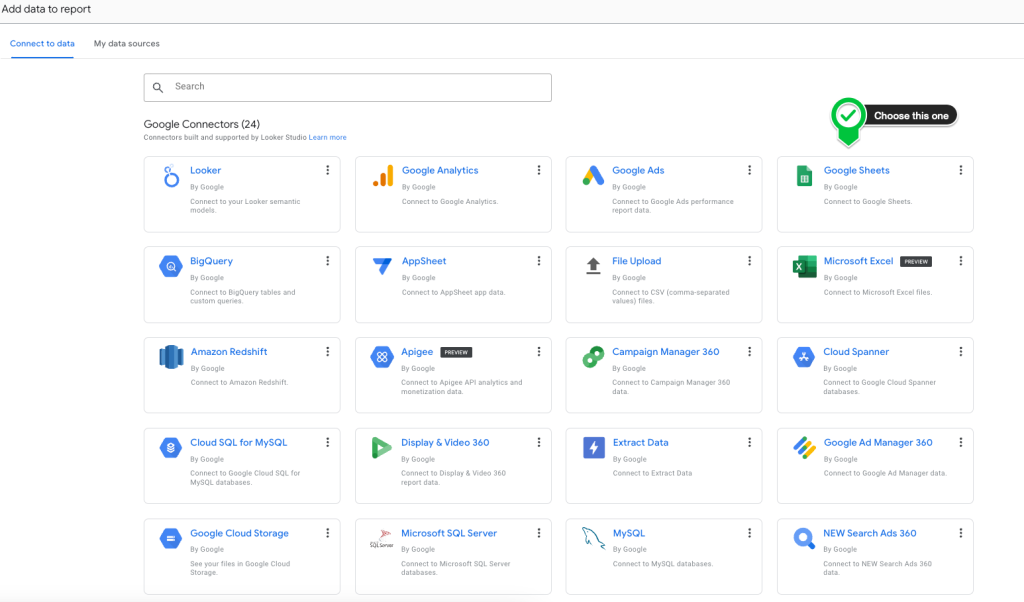
Image 6 – Choose the Google Sheets connector
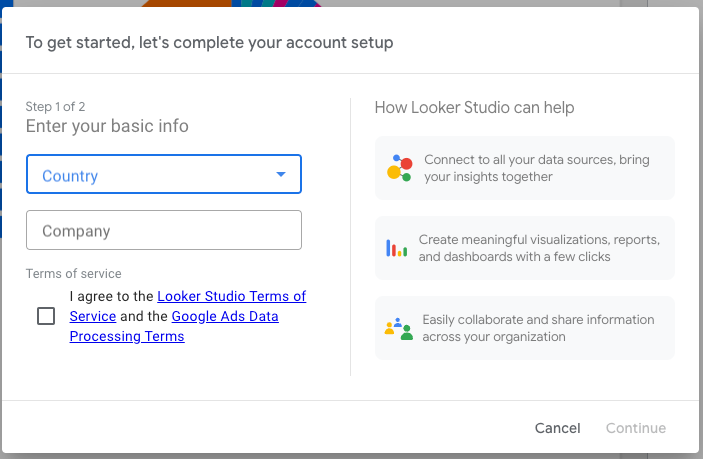
Image 7 – Looker account information
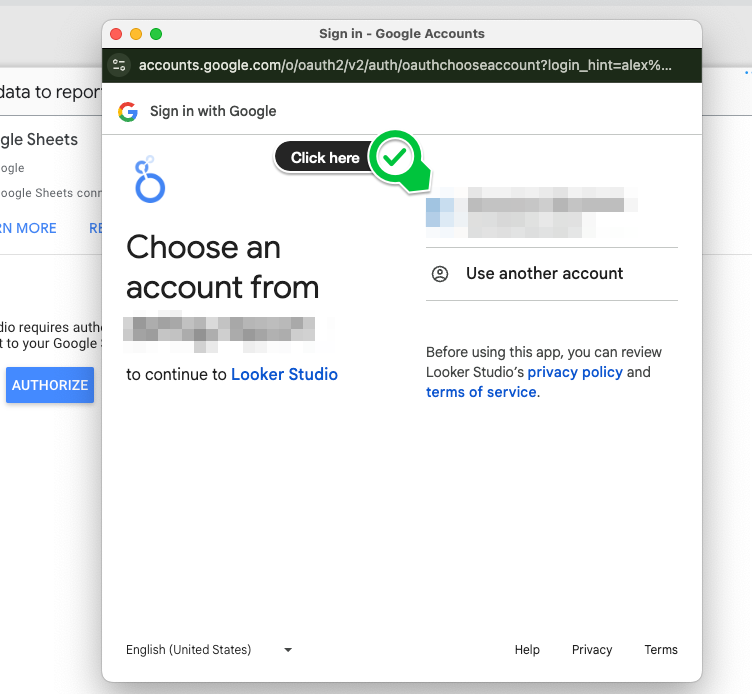
Image 8 – Authorization
Step 5: You must repeat Step 4 (click on Add data) and Step 5 for each remaining table (Ads, Inventory, Financial, and Performance). Choose your Defog on the list of Spreadsheets on your Google Drive (Image 9), then choose a table, as in Image 10, and click Add.
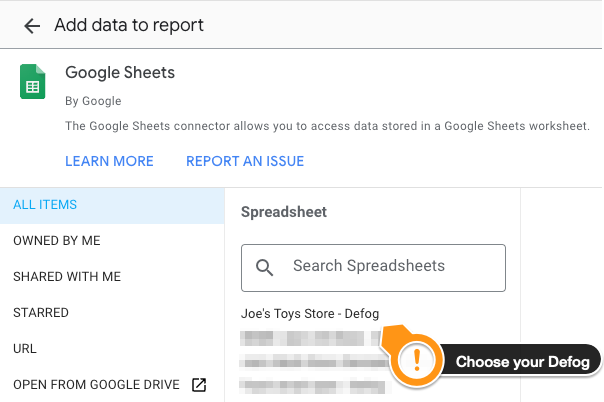
Image 9 – Choose your Defog
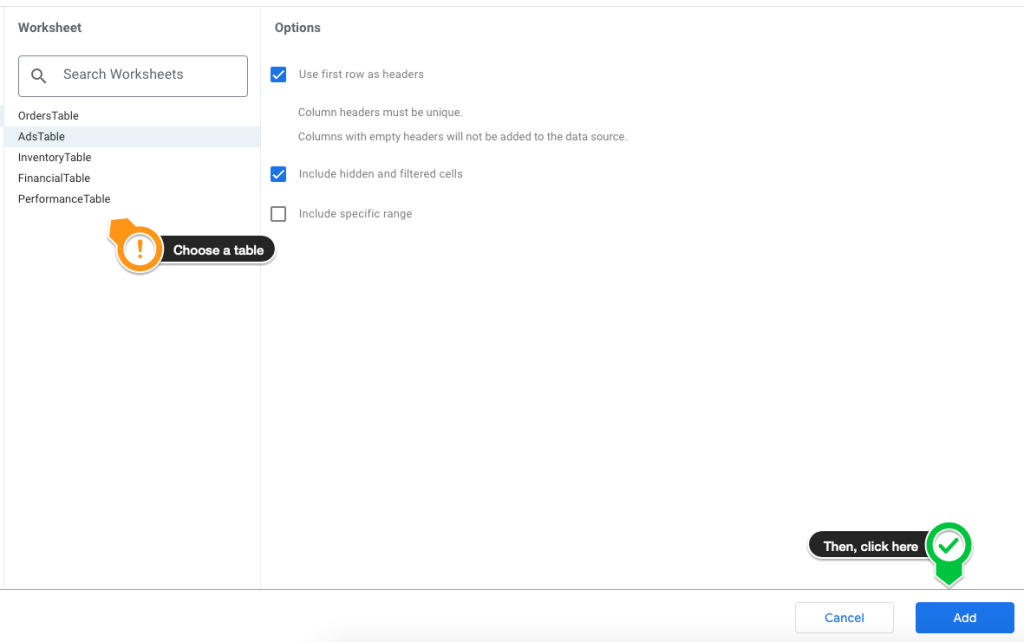
Image 10 – Choose a table and click Add
(Optional) Step 6: After connecting the 5 tables, we suggest you edit their name for simplicity. Here is how to do this. Click on Resource > Manage added data source (Image 11). Then click Edit in each table and edit its name on the next page (Images 12). Ultimately, you will have a list like the one in Image 13.
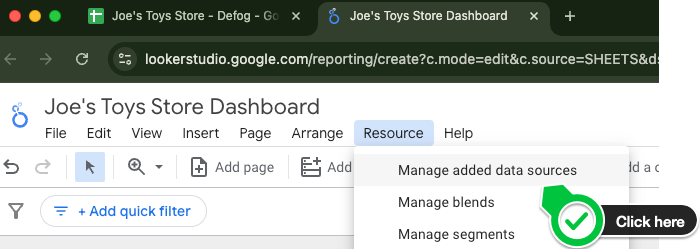
Image 11 – Manage data sources
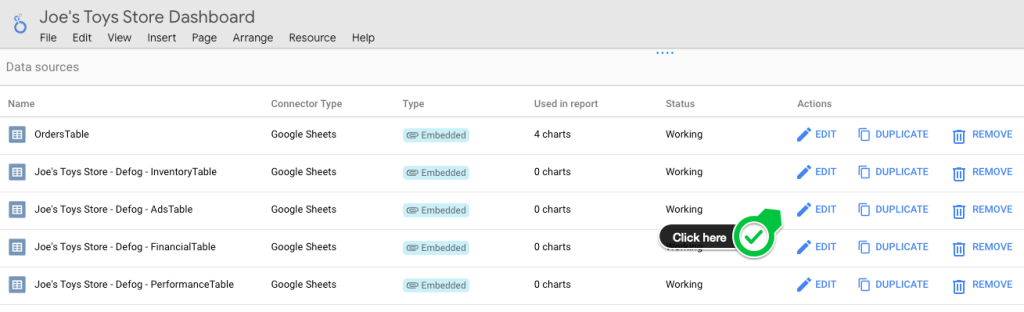
Image 12 – Click to edit the table’s name
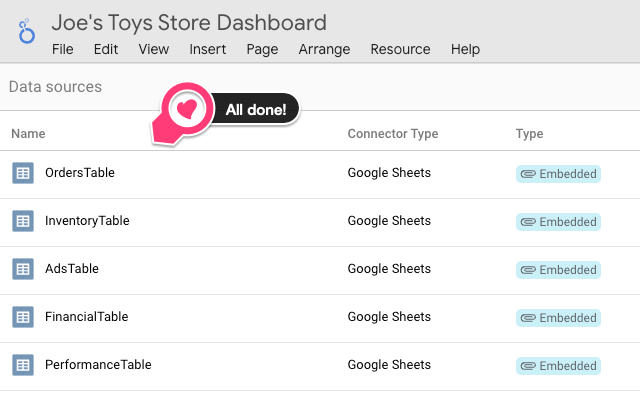
Image 13 – List of the 5 tables with the same name as in Defog
If you want to learn what a table column stands for, please click here to our glossary.
Thank you for reading this post. If you still haven’t used Defog, try it for free here.
If you need any help, we are here for you. Please click here for support.